
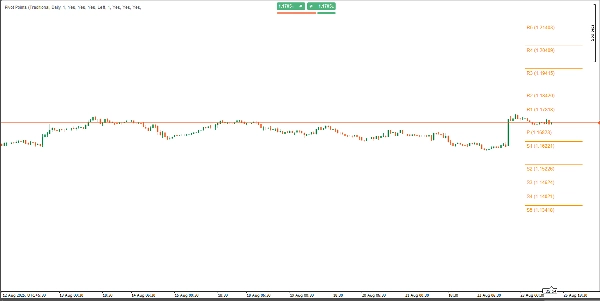
Pivot Point Daily Indicator
مؤشر
14 عمليات الشراء
الإصدار 2.0، May 2026
Windows, Mac
4.2
التقييمات: 4
الوصف
الميزات الرئيسية:
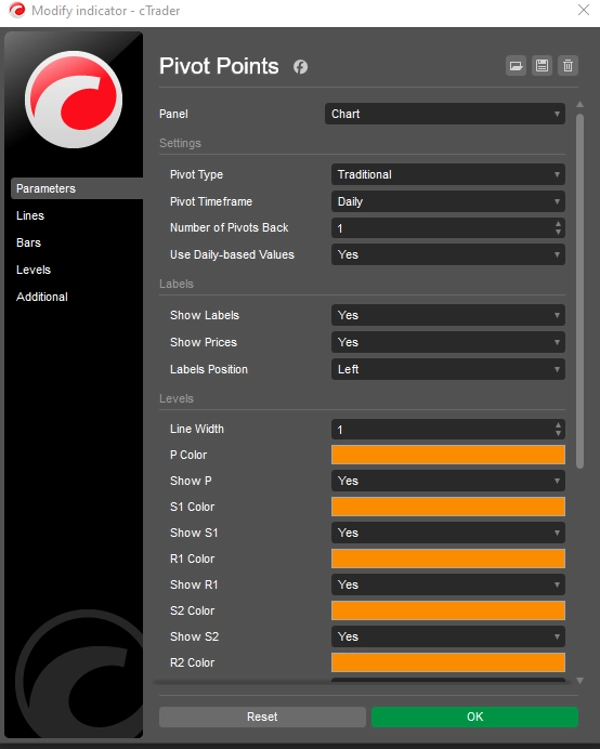
- أنماط المحاور المتعددة: التبديل بسلاسة بين ست طرق لحساب المحاور: كلاسيكي، فيبوناتشي، وودي، كاماريلا، DM، والتقليدي. كل طريقة تدعم مستويات مختلفة (حتى R5/S5 للتقليدي والكاماريلا، R3/S3 للفيبوناتشي، وP/R1/S1 لـ DM).
- أطر زمنية مرنة: اختر من مجموعة واسعة من أطر زمن المحاور، بما في ذلك تلقائي، يومي، أسبوعي، شهري، ربع سنوي، سنوي، وخيارات متعددة السنوات (نصف سنوي، ثلاثي السنوات، خمس سنوات، عشر سنوات). مثالي للتوافق مع أفق تداولك.
- التحكم في المحاور التاريخية: ضبط عدد مجموعات المحاور التاريخية للعرض (1–200) باستخدام معلمة عدد المحاور السابقة، لضمان مخطط خالٍ من الفوضى مع الحفاظ على المستويات التاريخية الرئيسية.
- مظهر قابل للتخصيص: ألوان قابلة للتعديل بالكامل، عرض الخطوط، وإعدادات العلامات. قم بتشغيل/إيقاف العلامات وقيم الأسعار، واختر مواقع العلامات (يسار أو يمين) مع إزاحات رأسية ذكية للوضوح.
- بيانات يومية أو داخل اليوم: خيار استخدام القيم اليومية أو بيانات إطار زمن المخطط، مما يوفر مرونة لاستراتيجيات تداول مختلفة.
- أداء محسن: كود cTrader خفيف الوزن وأصلي يضمن تحديثات سريعة في الوقت الحقيقي بدون تأخير، متوافق مع الفوركس، المؤشرات، السلع، العملات المشفرة، والمزيد.
لماذا تختار نقاط المحور القياسية؟
- أداة تداول متعددة الاستخدامات: تحديد مستويات الدعم/المقاومة الرئيسية، اتجاهات الاتجاه، وفرص الاختراق عبر أي سوق أو إطار زمني.
- واجهة سهلة الاستخدام: قوائم منسدلة بديهية لنوع المحور، الإطار الزمني، وموقع العلامة تجعل التخصيص سهلاً.
- التحليل التاريخي: تصور حتى 200 مجموعة محور تاريخية لدراسة تفاعلات الأسعار الماضية وتحسين استراتيجيتك.
- رسم بياني نظيف: وضع العلامات الذكي وأطوال الخطوط القابلة للتخصيص تمنع ازدحام المخطط، مما يعزز قابلية القراءة.
كيفية الاستخدام:
- قم بتطبيق المؤشر على مخطط cTrader الخاص بك.
- اختر نوع المحور المفضل لديك (مثل فيبوناتشي، كاماريلا) والإطار الزمني للمحور (مثل يومي، شهري).
- اضبط عدد المحاور السابقة للتحكم في مجموعات التاريخ المعروضة.
- خصص الألوان، عرض الخطوط، وإعدادات العلامات لتناسب أسلوبك.
- استخدم مستويات المحور لتحديد الدعم/المقاومة، تعيين وقف الخسارة/جني الأرباح، أو تداول الاختراقات.
مثالي لـ:
- متداولي اليوم: الاستفادة من محاور يومية أو أسبوعية للدخول والخروج داخل اليوم.
- متداولي التأرجح: استخدام محاور شهرية أو ربع سنوية لالتقاط الاتجاهات طويلة الأجل.
- المتداولين السريعين: الجمع مع أطر زمنية أقل لتنفيذ صفقات سريعة ودقيقة.
- جميع الأسواق: يعمل بسلاسة عبر الفوركس، الأسهم، العملات المشفرة، والسلع.
عزز ثقتك في التداول
مع نقاط المحور القياسية، تحصل على أداة قوية وشاملة تبسط التحليل الفني وتعزز قدرتك على اكتشاف فرص تداول عالية الاحتمالية. سواء كنت مبتدئًا أو متداولًا متمرسًا، يتكيف هذا المؤشر مع استراتيجيتك، موفرًا مستويات واضحة وقابلة للتنفيذ لرفع مستوى تداولك. جرب نقاط المحور القياسية اليوم وتحكم في تداولك بدقة ووضوح! دفعة واحدة. وصول مدى الحياة. تحديثات مستقبلية مشمولة.
الملخص
ملخص الذكاء الاصطناعي
Pivot Point Daily Indicator is a multi-timeframe pivot point tool designed for the cTrader platform. It supports six pivot calculation methods—Classic, Fibonacci, Woodie, Camarilla, DM, and Traditional—each offering various resistance and support levels (up to R5/S5 for some methods). Users can select from a broad range of timeframes including Auto, Daily, Weekly, Monthly, Quarterly, Yearly, and multi-year intervals, allowing alignment with different trading horizons.
The indicator allows displaying up to 200 historical pivot sets to analyze past price interactions while maintaining chart clarity through customizable label positions and line settings. It offers options to use daily-based or intraday data, enhancing flexibility for diverse trading strategies.
Pivot Point Daily Indicator is optimized for real-time performance with native cTrader coding, compatible across Forex, indices, commodities, cryptocurrencies, and other markets. Its interface includes intuitive dropdown menus for pivot type, timeframe, and label customization.
Traders can use this indicator to identify key support and resistance levels, trend directions, and breakout opportunities, aiding in setting stop-loss and take-profit points. It suits various trading styles including day trading, swing trading, and scalping across multiple asset classes.
ملف تعريف المؤشر
فئة المؤشر
الدعم والمقاومة
نوع المخرجات
فلتر
متطلبات البيانات
أعمدة السعر فقط
الإشارات المدعومة
كسر المستوى
تقييمات العملاء
4.2
التقييمات: 4
5 | 25 % | |
4 | 75 % | |
3 | 0 % | |
2 | 0 % | |
1 | 0 % |
تقييمات العملاء
May 2, 2026
Bought it, added it, used it for a while, and now it's disappeared, and I cannot get it back!
August 28, 2025
Good helper for review if the trader wants it keeps attention on levels that actually matter. It works best as support, not a final decision maker. The cleanest use is 3 to 5 levels per chart, with 0.5 pullbacks checked before entry. not every zone holds, even if it looks clean.
August 27, 2025
August 27, 2025
Usable tool with purpose for traders who build plans around market levels. It gives value around key price zones, but not every zone holds, even if it looks clean. I would wait for 2 reactions and avoid trades where the target is less than 1.5R. Levels are useful when they reduce noise, not when they crowd the chart.
مناقشة
الأسئلة الشائعة
Fibonacci
Prop
Forex
Breakout
Indices
Commodities
يتم توفير المنتجات المتاحة من خلال cTrader Store، بما في ذلك روبوتات التداول والمؤشرات والإضافات، من قبل مطوري الطرف الثالث وإتاحتها لأغراض الوصول المعلوماتي والفني فقط. cTrader Store ليس وسيطًا ولا يقدم نصائح استثمارية أو توصيات شخصية أو أي ضمان للأداء المستقبلي.


![شعار "[Stellar Strategies] MARSI Signal Plotter"](https://cdn.ctrader.com/image/webp/7b2b8da6-8f8e-4646-8d4a-4710c516c01e_25567)


السعر
منذ 30/05/2025
40
المبيعات