
VegaXLR - RSI and StochRSI Alerts
Indikator
15 pembelian
Versi 1.0, Apr 2025
Windows, Mac
5.0
Ulasan: 3
Penerangan
VegaXLR - RSI and StochRSI Alerts adalah penunjuk cTrader yang menyediakan amaran untuk peristiwa RSI dan StochRSI, memastikan pedagang sentiasa dimaklumkan tentang perubahan pasaran. Ia memberitahu pengguna mengenai tahap terlebih beli/terlebih jual, persilangan garis tengah, dan persilangan garis K/D, semuanya dengan tetapan yang boleh disesuaikan.
Ciri-ciri Utama:
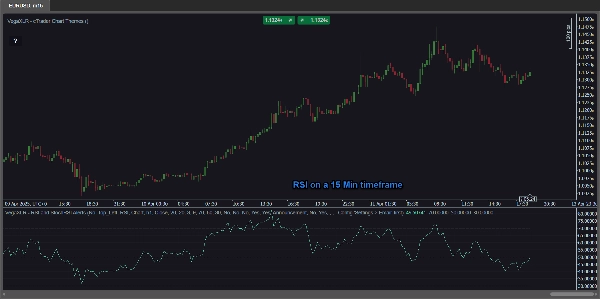
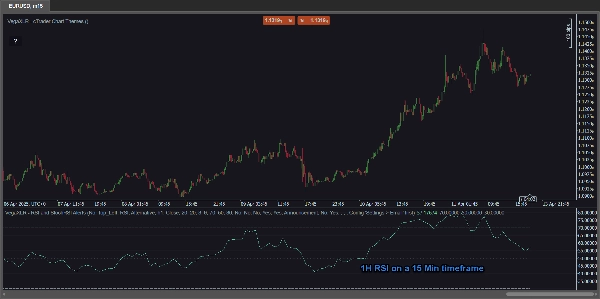
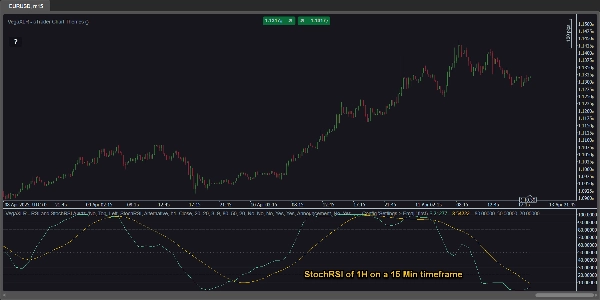
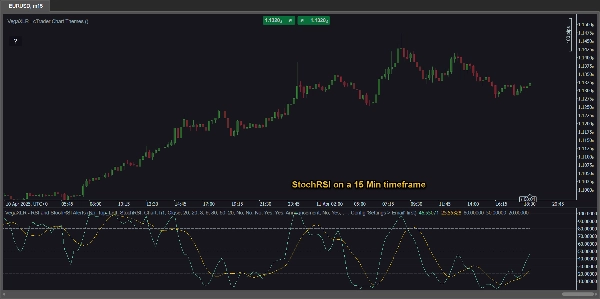
- Analisis Pelbagai Jangka Masa: Lihat nilai RSI dan StochRSI dari mana-mana jangka masa terus pada carta semasa anda. Contohnya, analisis RSI 1 jam sambil melihat carta 15 minit—tanpa menukar jangka masa carta anda!
- Amaran RSI & StochRSI: Terima pemberitahuan untuk:
-
- Keadaan terlebih beli & terlebih jual
- Persilangan garis tengah (50%)
- Persilangan garis K dan D (StochRSI)
- Tetapan Boleh Disesuaikan: Laraskan sumber RSI, tempoh, nilai K/D, dan ambang amaran untuk kawalan tepat.
- Amaran Serbaguna: Pilih daripada:
-
- Popup cTrader
- Amaran bunyi
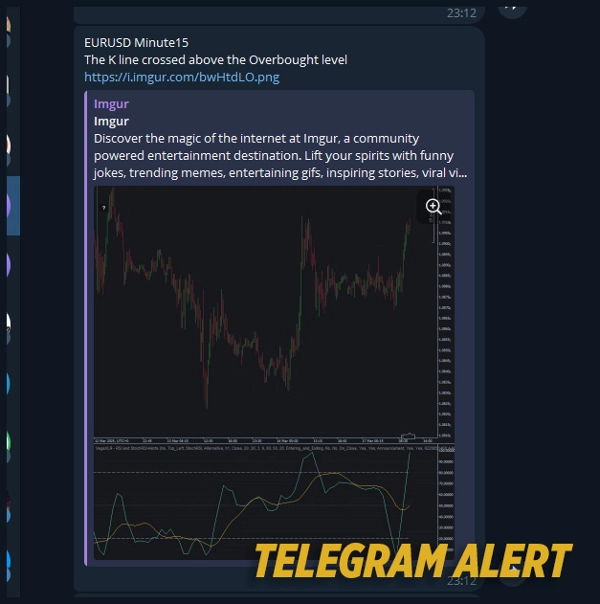
- Amaran Telegram (dengan tangkapan skrin carta pilihan)
- Pemberitahuan emel
- Garis RSI & StochRSI Terpadu: Tidak perlu penunjuk tambahan—ia sudah terbina dalam!
Panduan Akses Segera: Butang dalam carta yang mudah membuka manual pengguna.
Ringkasan
Ringkasan AI
VegaXLR - RSI and StochRSI Alerts is a cTrader indicator designed to monitor and notify traders of key RSI and StochRSI events. It provides alerts for overbought and oversold conditions, centerline (50%) crossovers, and K/D line crossovers within the StochRSI. The indicator supports multi-timeframe analysis, allowing users to view RSI and StochRSI values from any timeframe directly on their current chart without switching timeframes. Customizable settings enable adjustment of RSI source, periods, K/D values, and alert thresholds for tailored monitoring. Alert delivery options include cTrader popups, sound alerts, Telegram notifications (with optional chart screenshots), and email messages. The indicator integrates RSI and StochRSI lines internally, eliminating the need for additional indicators. An in-chart button provides instant access to the user manual for guidance. This tool assists traders in identifying precise market shifts and potential trade entry points based on momentum indicators.
Profil indikator
Ulasan pelanggan
5.0
Ulasan: 3
5 | 100 % | |
4 | 0 % | |
3 | 0 % | |
2 | 0 % | |
1 | 0 % |
Ulasan pelanggan
April 27, 2025
Steady choice for testing for traders who use momentum confirmation. It gives value around oscillator setups, but strong trends can keep signals stretched. A clean test needs 25 oscillator signals, 2 timeframe confirmation and a clear 1R exit plan. The tool is useful when overbought or oversold is treated as context, not a command.
April 26, 2025
April 26, 2025
Good enough to inspect for oscillator setups. it gives a familiar read on overextension and momentum, especially when used for checking stretched conditions before entries. RSI style levels around 30 and 70 help, but I would add a 2 swing divergence check. The tool is useful when overbought or oversold is treated as context, not a command.
Perbincangan
Soalan Lazim
RSI
Produk yang tersedia melalui cTrader Store, termasuk bot dagangan, indikator dan plugin, disediakan oleh pembangun pihak ketiga dan diberikan akses untuk tujuan maklumat dan teknikal sahaja. cTrader Store bukan broker dan tidak memberikan nasihat pelaburan, syor peribadi atau sebarang jaminan prestasi masa hadapan.


![Logo "[Hamster-Coder] Moving Average MTF"](https://cdn.ctrader.com/image/webp/b11b98b1-194d-4b8e-b00e-d611826ad159_31226)


Harga
215
Jualan
677
Pemasangan percuma