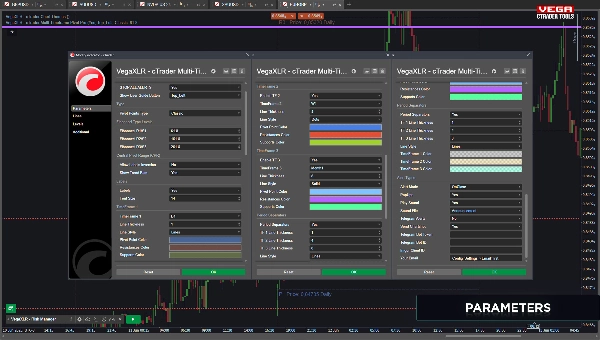
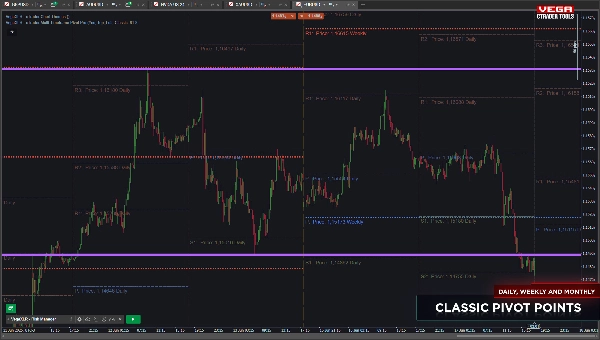
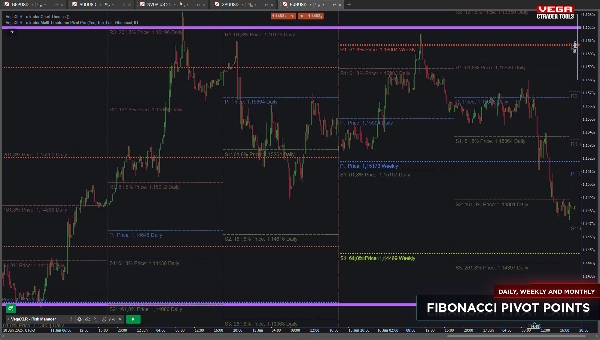
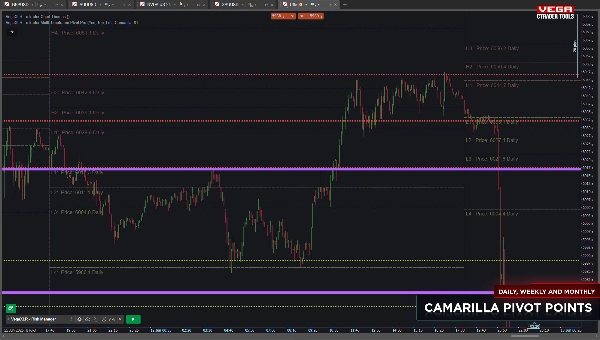
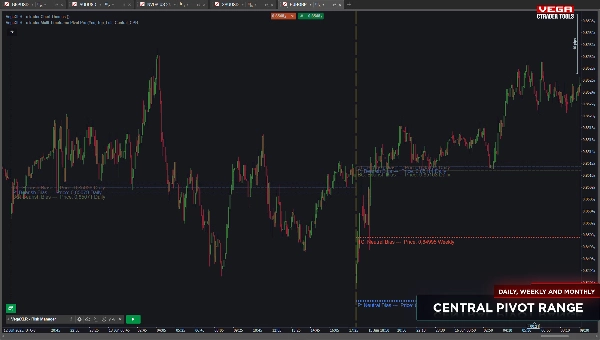
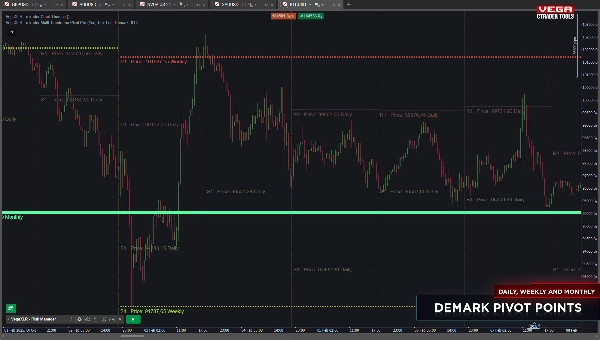
VegaXLR - cTrader Multi-Timeframe Pivot Pro
شعار "VegaXLR - cTrader Multi-Timeframe Pivot Pro"
5.0
08/09/2025
7
Desktop
صورة "VegaXLR - cTrader Multi-Timeframe Pivot Pro" المحملةصورة "VegaXLR - cTrader Multi-Timeframe Pivot Pro" المحملةصورة "VegaXLR - cTrader Multi-Timeframe Pivot Pro" المحملةصورة "VegaXLR - cTrader Multi-Timeframe Pivot Pro" المحملةصورة "VegaXLR - cTrader Multi-Timeframe Pivot Pro" المحملةصورة "VegaXLR - cTrader Multi-Timeframe Pivot Pro" المحملة

The cTrader Multi-Timeframe Pivot Pro is a highly customizable and feature-rich pivot point indicator for cTrader. It allows you to display pivot points for up to three timeframes of your choice, selecting from any timeframe available on the platform. The indicator supports multiple pivot styles, including Classic, Fibonacci, Demark, Camarilla, and Central Pivot Range (CPR), making it suitable for various trading strategies.

You can fully customize the labels, font sizes, colors, and pivot levels for all timeframes. For Fibonacci pivots, you can choose up to three levels (default: 61.8, 161.8, 261.8) along with the fixed 0% central pivot level. The CPR mode offers options like trend bias labels and inversion settings for added functionality.

Additional features include period separators to clearly mark trading periods and real-time alerts when the price interacts with pivot levels. Alerts can be sent via cTrader pop-ups, Telegram (with optional chart screenshots), or email, ensuring you never miss important price movements.

This indicator is ideal for traders looking for precision, flexibility, and advanced tools to enhance their technical analysis.


Here is a comprehensive list of features for the cTrader Multi-Timeframe Pivot Pro indicator:

  1. Multi-Timeframe Support:
    • Display pivot points for up to three customizable timeframes.
    • Choose from any timeframe available on the cTrader platform.
  2. Multiple Pivot Styles:
    • Classic
    • Fibonacci (with up to three levels: default 61.8, 161.8, 261.8)
    • Demark
    • Camarilla
    • Central Pivot Range (CPR) with trend bias labels and inversion settings.
  3. Customizable Appearance:
    • Fully adjustable label colors and font sizes.
    • Customizable pivot levels and styles for each timeframe.
  4. Real-Time Alerts:
    • Alerts triggered when the price interacts with any pivot level.
    • Notifications via cTrader pop-ups.
    • Telegram Alerts with chart screenshots.
    • Email notifications.
  5. Period Separators:
    • Clearly mark the start and end of trading periods on the chart.
  6. Enhanced Trading Analysis:
    • Provides key price levels for better trading decisions.
    • Supports various trading strategies with flexible pivot styles.

These features make the cTrader Multi-Timeframe Pivot Pro a versatile and powerful tool for traders looking to enhance their technical analysis and trading precision.

5.0
التقييمات: 1
5
100 %
4
0 %
3
0 %
2
0 %
1
0 %
تقييمات العملاء
June 25, 2025
Velice prospěšný pomocník, je dobré používat jako doplněk k jinému indikátoru.
المزيد من هذا المؤلف
الأعلى تقييمًا
مجاني
VegaXLR cTrader Toolbox
Centralized access to VegaXLR's cBots, indicators, and educational content in cTrader.
مؤشر
Breakout
VegaXLR - Fixed Range Volume Profile
Identify key support and resistance levels through detailed volume distribution analysis.
الأعلى تقييمًا
مجاني
مؤشر
Indices
Prop
Stocks
+3
VegaXLR - cTrader Chart Themes
Free chart themes for the cTrader platform.
مؤشر
Indices
Prop
Stocks
+3
VegaXLR - Unlimited Trendline Alerts
This is an indicator that can alert you about trendlines, horizontal lines and vertical lines.
cBot
Indices
Stocks
Forex
+2
VegaXLR - Risk Manager
Automate lot sizing with cTrader Risk Manager cBot for precise risk management in pending and market orders.
VegaXLR - Chart Patterns Alerts
Enhance your trading strategy with automated detection and alerts for key chart patterns.
مؤشر
Indices
Stocks
Forex
+1
VegaXLR - Moving Average Alerts
A powerful cTrader indicator with customizable Moving Average alerts, notifications, and automated trading actions.
VegaXLR - Candlestick Patterns Alerts
Real-Time Candlestick Pattern Detection with Custom Alerts & Trend Analysis for cTrader
VegaXLR - ZigZag Alerts
cTrader ZigZag Alerts: Precision Swing Detection, Alerts, and Fibonacci.
cBot
RSI
VegaXLR - cTrader Account Protector
This is an advanced tool designed to protect your trading account by managing drawdown and run-up levels.
VegaXLR - RSI and StochRSI Alerts
VegaXLR's cTrader StochRSI identifies overbought/oversold RSI levels for precise trade entries.
VegaXLR - Candlestick Patterns Pro
Identify 34 candlestick patterns, track trends across timeframes, and get instant alerts with this powerful trading tool
مؤشر
Forex
Crypto
VegaXLR - Bar Close Alert Manager
Bar Close Alert Manager provides real-time alerts for bar closures with customizable notifications and automation.
cBot
Indices
Stocks
Commodities
+2
VegaXLR - Trendline Trading cBot
This is a cBot that will detect trendlines on the chart and open trades when the price interacts with them.
VegaXLR - Auto Support and Resistance
cTrader Auto Support & Resistance detects key levels with Fibonacci analysis and sends real-time trading alerts.
VegaXLR - Market Sessions Alerts
The cTrader Market Sessions Alerts Indicator marks global sessions, highlights key levels, and sends real-time alerts.
cBot
Forex
VegaXLR - Fibonacci Trading cBot
Automate Fibonacci trading with this cTrader cBot—advanced risk management, alerts, and seamless order execution.
cBot
Forex
VegaXLR - Profit Defender
cTrader Profit Defender: Safeguard Your Gains with Advanced Trailing Stops.
قد يعجبك أيضًا
مؤشر
Indices
Breakout
Prop
+5
Squeeze Momentum Indicator 2.0version
Squeeze Momentum Indicator detects market consolidation periods and momentum breakouts using Bollinger Bands.
مؤشر
NAS100
NZDUSD
XAUUSD
+14
Order Block Scanner by PrimeQuant
Smart institutional order block & FVG scanner with alerts, zone merging, and HTF confluence.
الأعلى تقييمًا
مجاني
FairValueGap
This Fair Value Gap (FVG) indicator is a technical analysis tool used to identify potential price imbalances.
مؤشر
Indices
Prop
Stocks
+3
LT_Ind_Pivot
Draws pivots (P, S/R, CPR) from selected anchors like H1–Month1, with optional mid-levels (PS1, S1S2, etc.)
مؤشر
NAS100
NZDUSD
XAUUSD
+10
Moving Average PRO
Customize your Moving Average! Choose any timeframe and price source for precision and flexibility in your analysis.
DMI 3 bar v2
Shows BUY & SELL signals for 3 & 4 BAR PATTERN (Morning star/ Evening star). It is adjustable and it will SHOW ARROWS.
Candle Timer & Strength Panel Demo -
Candle Timer & Strength Panel DEMO for cTrader DEMO VERSION – 24 hours free trial! This is a DEMO version of the Candle
مؤشر
Grid
RSI
XAUUSD
+12
PFO Price Flow Oscillator
technical analysis tool designed to provide traders with a structured view of market momentum and volatility
مؤشر
Indices
Prop
Breakout
+8
MarketRegimeAI
A cutting‑edge trading indicator that fuses AI and mathematics with adaptive logic to classify market regimes.
مؤشر
NAS100
NZDUSD
XAUUSD
+11
ADXVMA Aurora Trend Filter
⚡ ADXVMA Aurora Trend Filter combines ADX trend strength with an adaptive EMA blend ⚡
مؤشر
NAS100
NZDUSD
RSI
+12
TrendFibonacci
The TrendFibonacci indicator is a powerful tool for traders, combining Fibonacci retracement levels
IR Moving Average
 this moving include everything that a trader needs from Moving Average.
IR Open Connector
This indicator connects the opening prices of higher timeframe candles (Daily, Weekly, Monthly, or
مؤشر
RSI
Breakout
XAUUSD
+13
LIQUIDITY POOL SIGNAL PRO
INDICATOR,LIQUIDITY POOLS,ACCURATE SIGNAL, NO DELAY,80% PROBABILITY
مؤشر
Forex
EURUSD
EconomicForex
ECONOMIC FOREX:provides insights into inflation, nominal interest rates and real interest rates, in the line chart
مؤشر
Indices
Prop
Stocks
+3
ADX Indicator_noSourceCode
Identify Trend Strength with Absolute Precision on cTrader
ICT MACRO THEORY
Are essentially short intervals during which the algorithm seeks liquidity or adjusts price.....
مؤشر
NAS100
NZDUSD
Breakout
+14
ZIG ZAG Free
ZigZag Free is a clean swing-detection tool that marks significant pivot highs/lows