
Deskripsi
Revolusionerkan Perdagangan Anda dengan Indikator Pola Grafik cTrader Ultimate
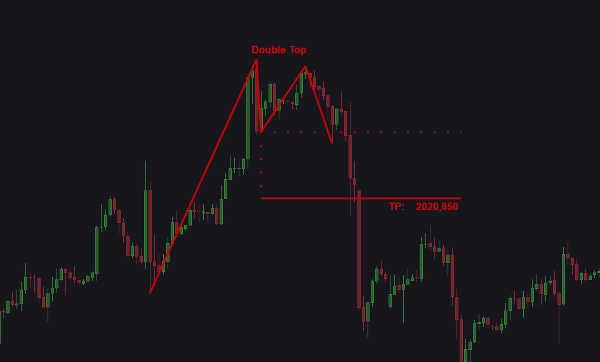
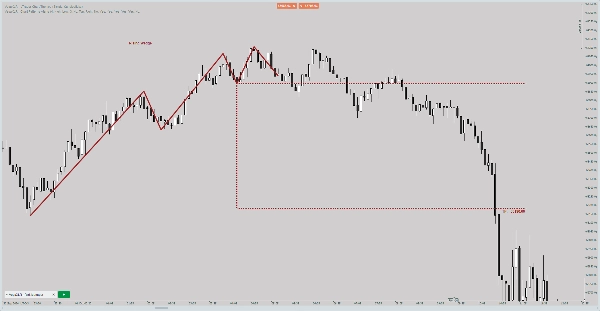
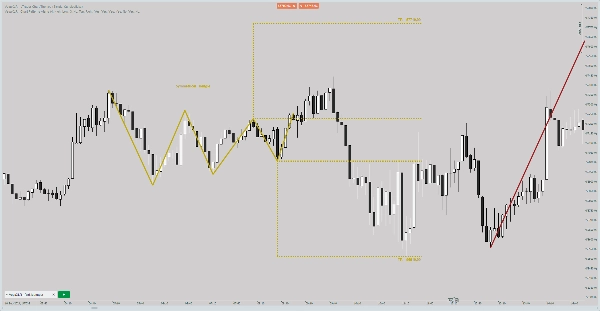
Bawa strategi perdagangan Anda ke tingkat berikutnya dengan indikator cTrader mutakhir, yang dirancang secara ahli untuk mendeteksi dan menyoroti pola grafik penting untuk analisis pasar yang tepat. Alat canggih ini mengidentifikasi pola kunci seperti Double Tops, Head and Shoulders, Ascending Triangles, dan lainnya, memberikan keunggulan kuat bagi trader dalam forex, perdagangan pasar saham dan semua pasar yang tersedia di platform cTrader.
Fitur Utama:
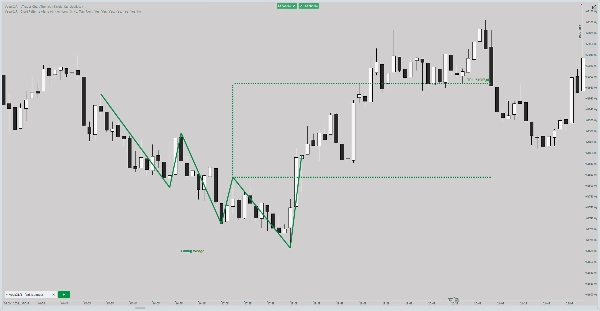
- Deteksi Pola Grafik Otomatis: Segera temukan pola seperti Bullish Flags, Symmetrical Triangles, dan Rising Wedges.
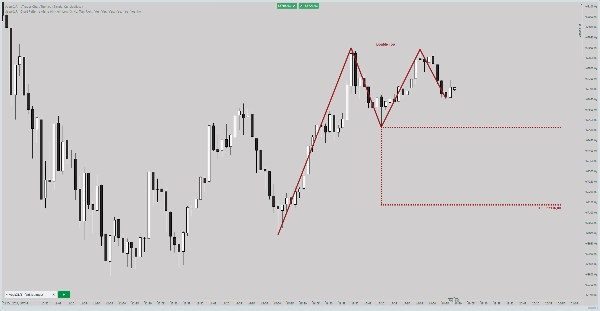
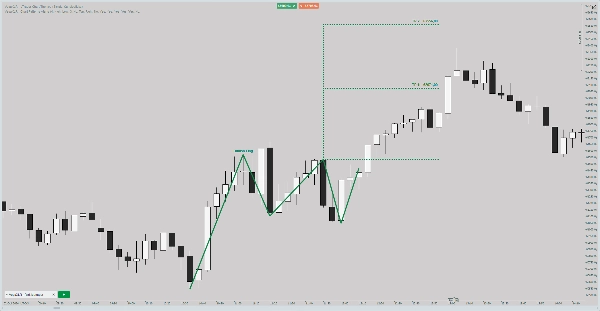
- Plot Ayunan Pola: Visualisasikan necklines, garis target, dan pergerakan harga dengan mudah.
- Peringatan yang Dapat Disesuaikan: Tetap terinformasi dengan peringatan melalui Suara, Pop-up, Telegram, atau Email—disesuaikan dengan kebutuhan Anda.
- Wawasan Berkode Warna: Dengan cepat membedakan antara bullish, bearish, dan pola netral menggunakan skema warna yang dapat disesuaikan.
- Daftar Pola dengan Statistik: Mudah melacak kemunculan pola dengan daftar terintegrasi yang menunjukkan singkatan dan jumlah.
- Tingkat Zoom yang Dapat Disesuaikan: Fokus pada ukuran pola untuk analisis mendetail.
- Tampilan Potensi Keuntungan: Evaluasi peluang perdagangan potensial dengan indikasi ukuran keuntungan yang jelas.
- Kejelasan Timeframe dan Simbol: Peringatan mencakup detail tepat tentang simbol dan timeframe untuk pengambilan keputusan yang tepat.
- Opsi Jeda Peringatan: Analisis pola tanpa gangguan dengan menjeda notifikasi.
- Fitur Catatan Pengguna: Tambahkan komentar untuk penyempurnaan strategi atau catatan khusus pola.
Pola Grafik yang Terdeteksi:
- Double Top
- Double Bottom
- Head and Shoulders
- Inverse Head and Shoulders
- Symmetrical Triangle
- Ascending Triangle
- Descending Triangle
- Bullish Flag
- Bearish Flag
- Rising Wedge
- Falling Wedge
Indikator perdagangan yang intuitif ini memberdayakan trader dengan menggabungkan deteksi pola grafik otomatis, peringatan yang dapat disesuaikan, dan visualisasi waktu nyata. Baik Anda berdagang di pasar forex, menganalisis grafik saham, atau menjelajahi indikator kustom cTrader, alat ini memberikan wawasan yang Anda butuhkan untuk membuat keputusan yang lebih cerdas dan percaya diri. Sempurna untuk trader yang ingin menguasai analisis teknikal dan mengoptimalkan manajemen risiko mereka.
Buka potensi perdagangan Anda hari ini dengan indikator cTrader yang komprehensif ini!
Peringatan:
Indikator ini adalah alat analisis teknikal yang dirancang untuk membantu trader dengan memberikan wawasan dan visualisasi berdasarkan pola grafik dan data pasar. Ini tidak berfungsi sebagai solusi perdagangan mandiri dan tidak menjamin hasil yang menguntungkan. Pengguna harus menerapkan strategi perdagangan, manajemen risiko, dan proses pengambilan keputusan mereka sendiri saat menggunakan produk ini. Kinerja masa lalu tidak menunjukkan hasil di masa depan. Perdagangan di pasar keuangan melibatkan risiko signifikan, dan Anda harus hanya berdagang dengan modal yang Anda mampu untuk kehilangan.
Ringkasan
Key functionalities include automatic pattern detection, real-time visualization of pattern components like necklines and target lines, and customizable alerts delivered via sound, pop-up, Telegram, or email. It features color-coded insights to distinguish bullish, bearish, and neutral patterns, a pattern list with occurrence statistics, adjustable zoom levels for detailed analysis, and profit potential display to evaluate trade opportunities. Alerts provide clear symbol and timeframe information, and users can pause notifications or add personal notes for strategy refinement.
This tool assists traders in technical analysis and risk management by providing actionable insights based on chart patterns. It is intended as a supportive tool and does not function as a standalone trading solution. Users must apply their own trading strategies and risk controls when using this indicator.
Ulasan pelanggan
5 | 67 % | |
4 | 0 % | |
3 | 33 % | |
2 | 0 % | |
1 | 0 % |


