
Descrizione
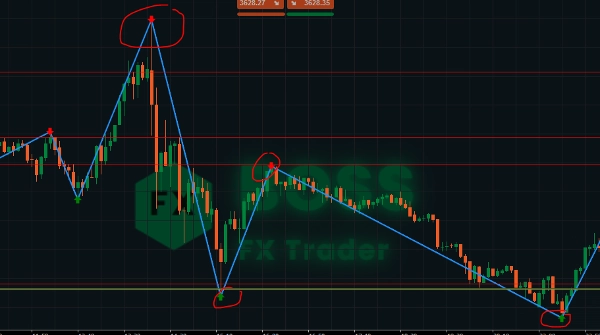
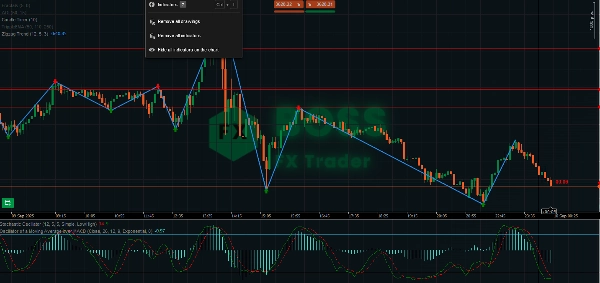
L'indicatore ZigZag è uno strumento di struttura di mercato che filtra le piccole fluttuazioni di prezzo e mette in evidenza massimi e minimi significativi. Collegando questi punti con linee, i trader possono facilmente identificare trend, inversioni e pattern grafici.
Non genera segnali di acquisto/vendita da solo, ma quando combinato con l'azione del prezzo, supporto/resistenza o altri indicatori, diventa potente per strategie di scalping, intraday e swing.
🔎 Caratteristiche principali
- Semplifica il rumore di mercato mostrando chiare oscillazioni di prezzo.
- Aiuta a identificare livelli di supporto e resistenza.
- Utile per individuare pattern grafici (testa e spalle, doppi massimi/minimi, triangoli).
- Supporta la conferma del trend e le entrate sui ritracciamenti.
- Indicatore freccia Sell e Buy
⚡ Scalping con ZigZag
- Timeframe: 1m – 5m
- Obiettivo: Catturare movimenti piccoli ma frequenti.
- Come usare:
-
- Aspetta la formazione di un nuovo massimo/minimo.
- Segna questi come micro-supporto o resistenza.
- Entra nelle operazioni su breakout o ritracciamenti a questi livelli ZigZag.
- Mantieni lo stop-loss appena oltre l'ultimo swing (rischio contenuto).
- Punta a un TP veloce (5–15 pips a seconda della volatilità).
👉 Funziona meglio nelle sessioni ad alta volatilità (apertura Londra / New York).
⏱️ Trading Intraday con ZigZag
- Timeframe: 15m – 1H
- Obiettivo: Operare sui trend giornalieri e sulle inversioni chiave intraday.
- Come usare:
-
- Identifica il trend intraday principale usando oscillazioni ZigZag più ampie.
- Usa i punti ZigZag come zone pivot per l'entrata (acquista i ritracciamenti in trend rialzista, vendi i rally in trend ribassista).
- Combina con oscillatori (RSI/Stocastico) per confermare condizioni di ipercomprato/ipervenduto vicino agli estremi ZigZag.
- Usa il massimo/minimo swing precedente come livelli logici di SL/TP.
👉 Ottimo per day trader che vogliono movimenti di 20–50 pips.
📆 Swing Trading con ZigZag
- Timeframe: 4H – Daily
- Obiettivo: Catturare grandi movimenti di trend e operazioni di posizione.
- Come usare:
-
- Usa ZigZag per identificare la struttura di mercato principale (massimi e minimi crescenti = trend rialzista).
- Entra dopo i ritracciamenti quando si forma un nuovo minimo in un trend rialzista.
- Posiziona lo SL sotto l'ultimo minimo importante.
- Punta a 2–3 volte il rischio, o al prossimo livello swing ZigZag.
- Usa ZigZag per individuare pattern di inversione (doppio massimo/minimo, testa e spalle) per le uscite.
👉 Ideale per mantenere le operazioni per giorni o settimane.
📌 Consigli professionali
- Regola la profondità: Minore = più sensibile (buono per scalping). Maggiore = filtra il rumore (meglio per swing).
- Combina con volume, filtri di trend o medie mobili per conferma.
- Controlla sempre lo ZigZag su timeframe più alti prima di entrare — piccoli swing all'interno di un trend più grande possono essere trappole.
- Usa ZigZag per la validazione dei pattern grafici (triangoli, cunei).
Rimanete trader profittevoli!
Riepilogo
Key features include simplification of market noise, identification of support and resistance levels, trend confirmation, and assistance with pullback entries. It supports multiple trading styles across various timeframes: scalping (1–5 minutes), intraday trading (15 minutes to 1 hour), and swing trading (4 hours to daily). Users can adjust the indicator’s sensitivity to suit different trading approaches and combine it with volume or moving averages for confirmation. The tool is applicable to diverse markets including Forex, indices, commodities, stocks, and cryptocurrencies, supporting symbols like EURUSD, GBPUSD, XAUUSD, NAS100, and BTCUSD.
Recensioni dei clienti
5 | 67 % | |
4 | 33 % | |
3 | 0 % | |
2 | 0 % | |
1 | 0 % |


