

VWAP Stdev Bands
Indicatore
Versione 1.0, Jul 2026
Windows, Mac

534.4M
Volume negoziato
9.76M
Profitto in pip
4
Vendite
Descrizione
Descrizione e Regole di Trading (Versione Inglese)
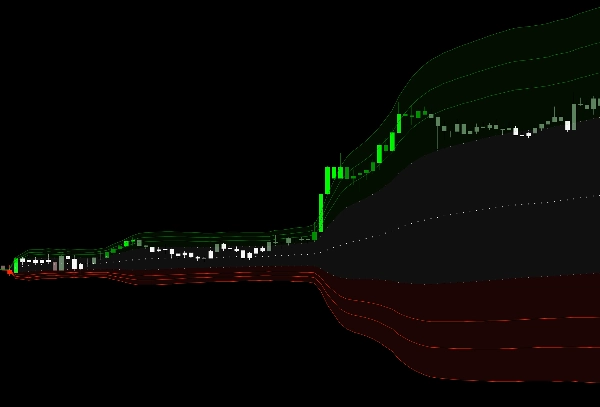
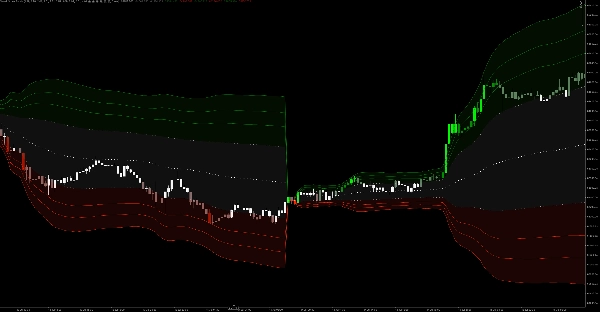
【Panoramica dell'Indicatore】 Questo indicatore ruota attorno al VWAP giornaliero (Prezzo Medio Ponderato per il Volume) e si espande verso l'esterno con 5 livelli di bande di Deviazione Standard (Stdev). Combinato con la nostra unica tecnologia di colorazione "Candlestick Heatmap", non solo mostra zone dinamiche di supporto e resistenza ma evidenzia visivamente condizioni di mercato estremamente ipercomprate e ipervendute, aiutando i trader a catturare con precisione le opportunità di ritorno alla media.
【Regole di Trading】
- Zona di Consolidamento e Osservazione (Bianco / Verde Scuro / Rosso Scuro): Quando le candele rimangono all'interno delle bande di deviazione standard 1° e 2°, il prezzo fluttua normalmente intorno alla media mobile. Si consiglia di seguire il trend o di restare in attesa.
- Zona di Trend Direzionale (Verde / Rosso Intenso): Quando le candele superano la 2° banda ed entrano nella 3°, il trend entra in una fase di accelerazione con forte momentum.
- Zona di Reversione Estrema (Lime / Rosso Vivo): Quando le candele raggiungono la 4° o 5° banda di deviazione standard e il colore diventa il Lime o Rosso più brillante, segnala un sentimento di mercato estremamente ipercomprato o ipervenduto. È molto probabile che si verifichi una "reversione alla media" (inversione netta), rappresentando un eccellente segnale per prendere profitti o effettuare ingressi contrari (andare contro il massimo/minimo).
Riepilogo
AI summary
VWAP Stdev Bands is a technical indicator centered on the Daily Volume Weighted Average Price (VWAP) enhanced with five tiers of standard deviation bands. It integrates a dynamic candlestick heatmap coloring system to visually represent support and resistance levels and highlight extreme market conditions. The indicator categorizes price action into zones: a consolidation zone within the first two standard deviation bands indicating normal fluctuation; a directional trend zone beyond the second band signaling strong momentum; and an extreme reversion zone at the fourth and fifth bands, marking overbought or oversold conditions likely to precede sharp reversals. This structure assists traders in identifying mean reversion opportunities and momentum phases. The indicator supports volume and bar data inputs and provides visual outputs suitable for trend analysis, volatility regime detection, reversal signals, breakouts, and level touches or breaks. It is designed for use in markets where VWAP and volume data are available.
Profilo indicatore
Categoria indicatore
Trend
Tipo di output
Visualizzazione
Requisiti per i dati
Solo barre
Volume
Segnali supportati
Volatilità
Forza del trend
Inversione
Rottura
Livello raggiunto
Livello rotto
Recensioni dei clienti
0.0
Recensioni: 0
Recensioni dei clienti
Questo prodotto non ha ancora ricevuto recensioni. L'hai già provato? Fallo sapere agli altri per primo!
Discussioni
Domande frequenti
Volume
Moving Average
VWAP
Support & Resistance
I prodotti disponibili tramite cTrader Store, inclusi bot di trading, indicatori e plugin, sono forniti da sviluppatori terzi e resi disponibili esclusivamente a scopo informativo e di accesso tecnico. cTrader Store non è un broker e non fornisce consulenze in materia di investimento, raccomandazioni individualizzate o garanzie di risultati futuri.
Altro da questo autore





















Prezzo
534.4M
Volume negoziato
9.76M
Profitto in pip
4
Vendite