
Description
Imperium MTF Heatmap is a unique top-tier indicator for cTrader, created for traders who want more than signals — they want market control, visual clarity, and real trading value.
This indicator is engineered to reveal the true structure of short-term market movement by combining multi-timeframe alignment, moving average logic, directional strength, and confirmation behavior into one powerful heatmap system.
Its greatest advantage is not just what it shows, but how quickly and clearly it shows it. In fast markets, decisions must be made instantly. Imperium MTF Heatmap helps you identify bullish and bearish pressure, confirm momentum quality, and spot alignment across key layers without cluttering your chart with unnecessary noise.
The default settings are specifically optimized for Tick30 and Minute1, making this indicator exceptionally valuable for active traders who operate in fast, precision-based environments. From the moment you apply it, it is ready to work.
This is a premium indicator with real staying power.
It is the kind of tool that quickly becomes part of your trading routine because it gives you information that is hard to ignore once you have seen it in action.
Many indicators are used for a while and then removed.
Imperium MTF Heatmap is different.
It delivers such a practical and immediate visual advantage that it naturally becomes one of those indicators you keep returning to every day. Once it is on your chart and you start reading the market through it, trading without it feels like losing an important layer of awareness.
If you want a unique, powerful, and genuinely useful indicator for Tick30 and Minute1 trading, Imperium MTF Heatmap is exactly that.
How to Use Imperium MTF Heatmap
Imperium MTF Heatmap is designed to help you read market direction, strength, and alignment in a fast and visual way.
Instead of relying on multiple separate indicators, it gives you an instant overview of trend pressure across multiple layers.
At its core, the indicator shows whether the market is leaning bullish or bearish, how strong that pressure is, and whether the different rows are aligned. This makes it much easier to spot high-quality trading conditions and avoid weak or noisy setups.
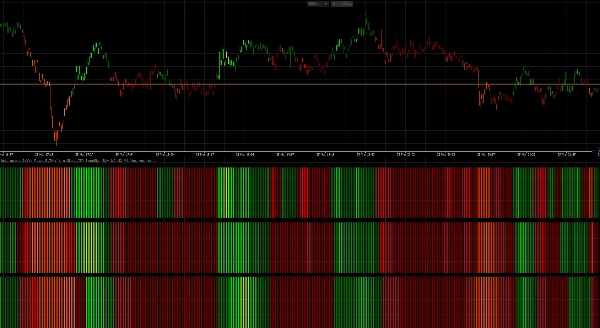
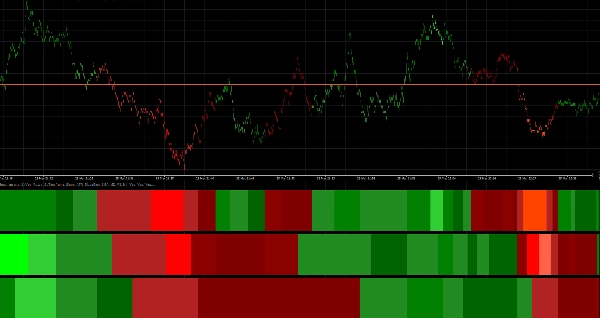
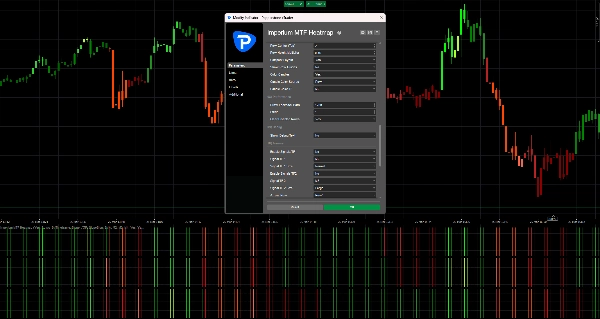
What the heatmap shows
The heatmap is built with 3 rows, and each row represents a separate timeframe or moving average layer depending on your layout.
- Green zones indicate bullish pressure
- Red zones indicate bearish pressure
- Brighter / stronger color intensity means stronger momentum or trend strength
- Weak or unstable conditions appear less powerful and should be treated with more caution
When multiple rows are aligned in the same direction, the market usually has better structure and cleaner momentum.
That is where the indicator becomes especially valuable.
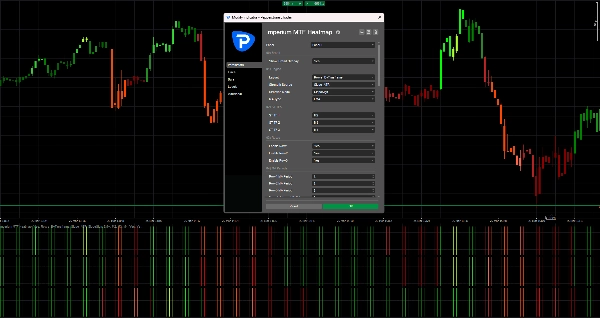
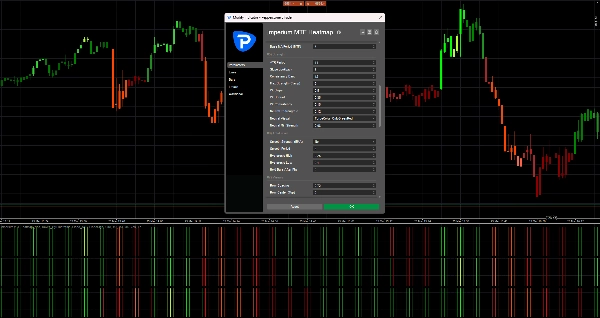
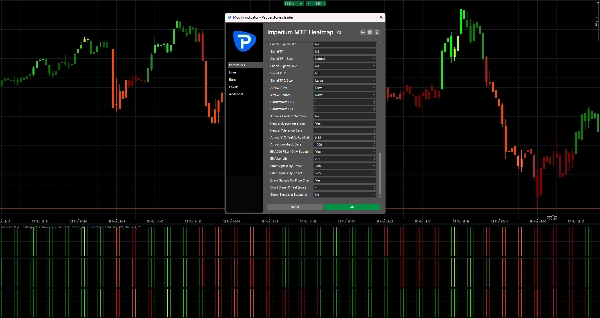
Default setup
The default settings are optimized for:
- Tick30
- Minute1
This means the indicator is ready to use immediately for fast-paced trading environments such as scalping and short-term intraday trading.
Default structure:
- Row 1 = M2
- Row 2 = M3
- Row 3 = M4
This creates a compact multi-timeframe view that helps you quickly judge whether short-term momentum is supported by the next layers above it.
How to read the indicator
1. Look at Row 1 first
Row 1 gives you the fastest read on short-term direction and immediate pressure.
Use Row 1 to answer:
- Is momentum currently bullish or bearish?
- Is there active pressure in the market right now?
- Is the move strong or weak?
Row 1 is the first layer of information, but it should not always be traded on its own.
2. Use Row 2 and Row 3 for confirmation
Row 2 and Row 3 act as filters.
If Row 1 turns green but Row 2 and Row 3 remain red, the move may be weak, early, or simply a short-lived pullback.
If all rows align in the same direction, that usually signals stronger structure and better trade quality.
General rule:
- 1 row aligned = early signal
- 2 rows aligned = stronger confirmation
- 3 rows aligned = highest-quality directional confluence
Best way to use it in trading
Bullish setup
A stronger bullish setup is when:
- Row 1 is green
- Row 2 is green
- Row 3 is green
- color intensity is solid or increasing
- price action supports continuation
This tells you that bullish pressure is not isolated, but supported across the full heatmap structure.
Bearish setup
A stronger bearish setup is when:
- Row 1 is red
- Row 2 is red
- Row 3 is red
- color intensity is solid or increasing
- price action supports downside continuation
This suggests bearish control and better probability for short entries or continuation trades.
Practical trading approach
A simple way to use Imperium MTF Heatmap:
Aggressive entry style
Enter when:
- Row 1 flips strongly
- Row 2 begins to support the move
- momentum builds quickly
This style gives earlier entries, but also more risk.
Conservative entry style
Enter only when:
- Row 1, Row 2, and Row 3 are aligned
- the color is stable and strong
- the move is supported by clean price action
This style gives fewer entries, but often better quality.
Candle coloring
The indicator can also color candles based on the heatmap direction.
This helps you:
- stay visually aligned with the current bias
- avoid trading against active pressure
- read the market faster without checking every row manually
With the default settings, candle coloring is linked to M2, which fits well with the fast trading logic of Tick30 and Minute1 charts.
Signal arrows
If enabled, the signal arrows can help highlight potential buy and sell opportunities.
These arrows are not meant to replace market reading.
They work best when used together with heatmap alignment.
Best practice:
- Use arrows only in the direction of the full heatmap bias
- Give more value to arrows when Row 2 and Row 3 confirm Row 1
- Ignore arrows during mixed or conflicting heatmap conditions
In your current defaults, the signal arrows are turned off, which keeps the chart clean and puts the focus on the heatmap itself.
What to avoid
Do not use the indicator blindly.
Avoid taking trades when:
- rows are mixed
- colors are weak and unstable
- heatmap direction changes rapidly
- the market is choppy or range-bound
- price action clearly disagrees with the heatmap structure
The indicator is strongest when it is used as a decision support tool, not as a standalone auto-entry system.
Best use cases
Imperium MTF Heatmap is especially effective for:
- scalping
- short-term momentum trading
- trend continuation entries
- pullback confirmation
- multi-timeframe confluence analysis
- filtering weak trades
- staying aligned with market pressure
Why traders keep using it
This indicator becomes powerful because it compresses a lot of important market information into one quick visual read.
Once you start using it regularly, you begin to notice:
- direction faster
- strength more clearly
- alignment more confidently
- weak setups earlier
- better timing in active markets
That is why it often becomes one of those indicators traders keep on their chart all the time.
Simple rule to remember
Green alignment = look for buys
Red alignment = look for sells
Mixed heatmap = wait
That single principle already makes the indicator highly practical.
Summary
Traders use the heatmap to quickly assess market direction, momentum quality, and alignment across multiple layers, aiding in identifying high-quality trade setups and filtering out weak or noisy conditions. The indicator supports both aggressive and conservative entry styles based on the alignment and strength of the heatmap rows. It can also color candles according to the dominant heatmap direction for faster market reading.
Optional signal arrows highlight potential buy and sell opportunities but are intended as a supplement to heatmap analysis rather than standalone signals. Imperium MTF Heatmap is particularly suited for scalping, short-term momentum trading, trend continuation, pullback confirmation, and multi-timeframe confluence analysis across various markets including Forex, indices, commodities, stocks, and cryptocurrencies. It functions as a decision support tool to enhance market awareness and timing in active trading environments.
Customer reviews
5 | 50 % | |
4 | 50 % | |
3 | 0 % | |
2 | 0 % | |
1 | 0 % |


