الوصف
قائد SR
تجربة مجانية Big Brother: قائد SR متعدد الأطر الزمنية https://ctrader.com/products/3833?u=ALGO-XL
قائد SR هو مؤشر دعم ومقاومة نظيف وذكي لمنصة cTrader، مصمم لمساعدة المتداولين على تحديد مستويات السوق الرئيسية، وقراءة موقع السعر فورًا، والتفاعل بشكل أسرع مع سيناريوهات الاختراق، والانهيار، والرفض.
بدلاً من إزدحام الرسم البياني بضوضاء غير ضرورية، يركز قائد SR على ما يهم أكثر: الدعم والمقاومة القابلة للتنفيذ الأقرب حول السعر الحالي، مع نظام حالة بصري بسيط يخبرك ما إذا كان السوق في حالة شراء، بيع، أو انتظار.
هذا يجعله مفيدًا بشكل خاص للمتداولين الذين يريدون رؤية سريعة ومنظمة لسلوك السوق دون الحاجة إلى تحديد المستويات يدويًا على كل رسم بياني.
كيف يعمل قائد SR
يقوم قائد SR بمسح حركة السعر الأخيرة وتحديد أهم الشموع ضمن منطق النظر للخلف المحدد. يجمع هذا مع حساب قائم على التقلب لبناء مستويات دعم ومقاومة ذات معنى حول سعر السوق الحالي.
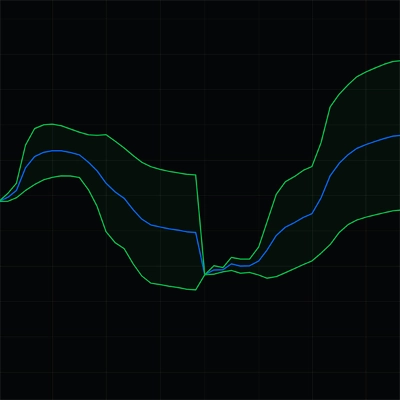
من تلك المستويات المكتشفة، يختار المؤشر تلقائيًا أقرب دعم أسفل السعر وأقرب مقاومة أعلى السعر. ثم تُرسم هذه المستويات مباشرة على الرسم البياني كخطوط أفقية واضحة، مما يمنحك فهمًا فوريًا لمكان تواجد السعر حاليًا داخل هيكل السوق.
بمجرد تأسيس هذه المستويات، يقيم قائد SR حالة السوق الحالية:
- شراء / اختراق
إذا أغلق السعر فوق أقرب مستوى مقاومة، مع وجود هامش اختراق قابل للتعديل، يفسر المؤشر هذا كاختراق صعودي. - بيع / انهيار
إذا أغلق السعر تحت أقرب مستوى دعم، مع وجود عتبة انهيار قابلة للتعديل، يفسر المؤشر هذا كانهيار هبوطي. - انتظار
إذا بقي السعر بين الدعم والمقاومة، يشير المؤشر إلى أن السوق لا يزال داخل النطاق ولم يحدث اختراق اتجاهي واضح.
تساعد هذه المنطق المتداولين على تجنب اتخاذ قرارات عاطفية وتوفر إطارًا أكثر موضوعية لقراءة هيكل السوق.
مصمم لاتخاذ قرارات حقيقية على الرسم البياني
قائد SR ليس مجرد رسم خطوط. إنه مصمم لمساعدة المتداولين على فهم ما يفعله السعر عند تلك الخطوط.
بالإضافة إلى اكتشاف حالات الاختراق والانهيار، يمكن للمؤشر أيضًا تحديد:
- إشارات ارتداد شراء عندما يختبر السعر الدعم ويغلق مرة أخرى فوقه مع تأكيد صعودي
- إشارات رفض بيع عندما يختبر السعر المقاومة ويغلق مرة أخرى تحتها مع تأكيد هبوطي
- علامات اختراق وانهيار تاريخية بحيث يمكن مراجعة ردود أفعال السوق السابقة مباشرة على الرسم البياني
- نقاط رد فعل شراء وبيع تاريخية اختيارية للمتداولين الذين يرغبون في دراسة سلوك الدعم/المقاومة في الماضي
هذا يجعل قائد SR مفيدًا ليس فقط للتحليل المباشر، ولكن أيضًا لمراجعة الرسوم البيانية، والتعرف على الأنماط، وتوثيق التداول.
هيكل بصري نظيف
واحدة من نقاط قوة قائد SR هي بساطته. المؤشر مصمم ليظل واضحًا بصريًا مع تقديم معلومات حاسمة.
يمكنه عرض:
- أقرب مستويات الدعم والمقاومة
- تسميات سعرية اختيارية على الخطوط
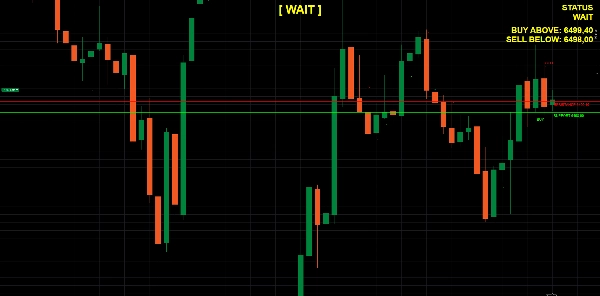
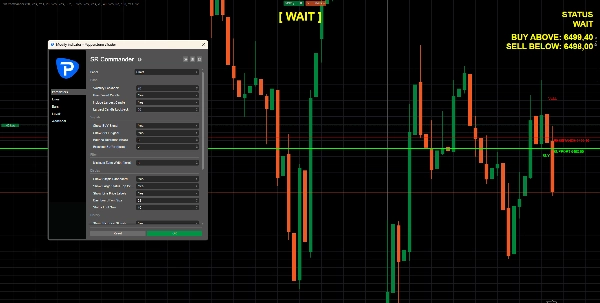
- لوحة تحكم مدمجة تُظهر حالة السوق الحالية
- رسالة حالة مركزية كبيرة مثل شراء، بيع، أو انتظار
- رموز تاريخية لأحداث الاختراق والانهيار السابقة
النتيجة هي رسم بياني يبقى مقروءًا وفعالًا، حتى خلال ظروف السوق النشطة.
منطق تصفية ذكي
يتضمن قائد SR أيضًا مرشحات عملية لتحسين جودة الإشارات.
على سبيل المثال، يمكن للمؤشر تجاهل الحالات التي تكون فيها المسافة بين الدعم والمقاومة صغيرة جدًا. عندما يصبح النطاق الحالي ضيقًا جدًا، قد يكون السوق مضغوطًا جدًا أو غير واضح لاتخاذ قرارات ذات معنى. في مثل هذه الحالات، يعيد المؤشر حالة انتظار بدلاً من فرض إشارة منخفضة الجودة.
يساعد هذا في تقليل الإنذارات الكاذبة ويحافظ على التركيز على فرص التداول الأنظف.
الميزات الرئيسية
- يكتشف تلقائيًا مستويات الدعم والمقاومة ذات الصلة
- يبرز أقرب المستويات القابلة للتنفيذ حول السعر الحالي
- يحدد حالات السوق اختراق، انهيار، وانتظار
- إشارات ارتداد شراء واختيارية وإشارات رفض بيع
- تصوير الاختراق والانهيار التاريخي
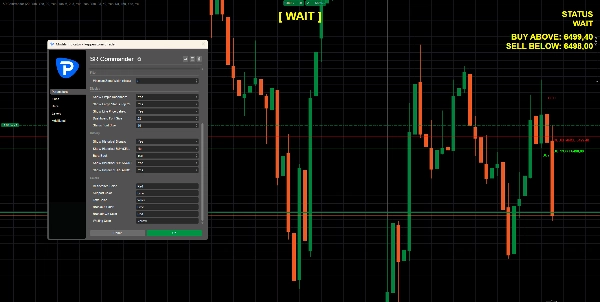
- هامش اختراق وقبول ارتداد قابل للتعديل
- استخدام اختياري لتأكيد إغلاق الشمعة
- لوحة تحكم نظيفة وعرض حالة كبير
- تصميم بصري بسيط لقراءة سريعة للرسم البياني
لمن هذا المؤشر
قائد SR مناسب للمتداولين الذين يعتمدون على هيكل السعر واتخاذ القرار بناءً على المستويات، بما في ذلك:
- متداولو الاختراق
- متداولو حركة السعر
- متداولو التداول اليومي
- متداولو التأرجح
- المتداولون التقديريون الذين يريدون هيكل رسم بياني أنظف
- المتداولون الذين يبحثون عن تأكيد بصري سريع حول الدعم والمقاومة
سواء كنت تتداول الانعكاسات، أو إعادة الاختبار، أو كسر النطاق، أو التحركات المستمرة، يساعدك قائد SR على البقاء مركزًا على أهم المستويات على الرسم البياني.
لماذا تستخدم قائد SR
غالبًا ما تصبح الأسواق مربكة عندما تتنافس العديد من المؤشرات على الانتباه. يحل قائد SR هذه المشكلة من خلال إعطاء المتداولين رؤية منظمة وقابلة للقراءة للسوق من خلال أحد أهم المفاهيم في التحليل الفني: الدعم والمقاومة.
من خلال الجمع بين اكتشاف المستويات، والمنطق الواعي للتقلبات، والتعرف على الارتداد/الرفض، وحالة الاختراق في أداة واحدة نظيفة، يساعد قائد SR المتداولين على الإجابة بسرعة على ثلاثة أسئلة أساسية:
- أين السعر الآن؟
- هل السوق يخترق، ينهار، أم لا يزال في نطاق؟
- هل السعر يتفاعل بقوة أو رفض عند المستويات الرئيسية؟
هذا يخلق سير عمل أكثر انضباطًا ويسمح للمتداولين باتخاذ قرارات بوضوح أكبر وضوضاء أقل على الرسم البياني.
ملاحظة مهمة
تم تصميم قائد SR كأداة دعم اتخاذ قرار للتحليل الفني. لا يضمن صفقات رابحة ويجب دائمًا استخدامه جنبًا إلى جنب مع سياق السوق الخاص بك، وطرق التأكيد، وقواعد إدارة المخاطر.
الملخص
SR Commander identifies breakout and breakdown scenarios when price closes beyond the nearest resistance or support levels, respectively, with adjustable buffers. It also signals buy bounces and sell rejections when price tests and reacts to these levels. Historical breakout and breakdown events are marked on the chart for review and pattern recognition.
The indicator features smart filtering to avoid low-quality signals, such as ignoring zones where support and resistance are too close. Its clean visual layout includes optional price labels, a large status message, and historical reaction points, facilitating fast and structured market analysis.
SR Commander supports traders focusing on price structure and level-based strategies, including breakout, price action, intraday, and swing trading across various markets such as forex, indices, commodities, stocks, and cryptocurrencies. It serves as a decision-support tool to enhance clarity and reduce chart noise in technical analysis.