
الوصف
مؤشر التقدير الكمي النوعي (QQE) متعدد الأطر الزمنية
إن مؤشر التقدير الكمي النوعي (QQE) هو أداة تحليل فني تعزز مؤشر القوة النسبية (RSI) من خلال دمج المتوسطات المتحركة الملساء. يساعد المتداولين على تقييم قوة الاتجاه، الانعكاسات المحتملة، وحالات الشراء أو البيع المفرط بدقة أكبر.
يتميز QQE بمكونين رئيسيين: مستويات وقف الخسارة السريعة والبطيئة المتتبعة، التي تعمل كدعم ومقاومة ديناميكية. هذا يجعله أداة متعددة الاستخدامات لكل من استراتيجيات متابعة الاتجاه واستراتيجيات الارتداد إلى المتوسط. غالبًا ما يشير التقاطع بين خط QQE وخط الإشارة الخاص به إلى فرص شراء أو بيع محتملة.
QQE متعدد الأطر الزمنية: نسخة متقدمة
تم تصميم هذا الإصدار المحسن من مؤشر QQE كـ أداة متعددة الأطر الزمنية، تدمج بين خطوط الاتجاه السريعة والبطيئة لتحسين الدقة. من خلال تحليل حركة السعر عبر أطر زمنية متعددة، يوفر رؤية شاملة لاتجاهات السوق.
تعزز خوارزمية التنعيم المتقدمة موثوقيته، مما يجعله مؤشرًا فعالًا قائمًا بذاته لـ:
✅ تحديد اتجاه الاتجاه
✅ توليد إشارات دخول وخروج دقيقة
✅ كشف حالات الشراء والبيع المفرط
تجعل مرونة QQE متعدد الأطر الزمنية منه مناسبًا لكل من استراتيجيات متابعة الاتجاه والانعكاس.
كيفية استخدام QQE متعدد الأطر الزمنية
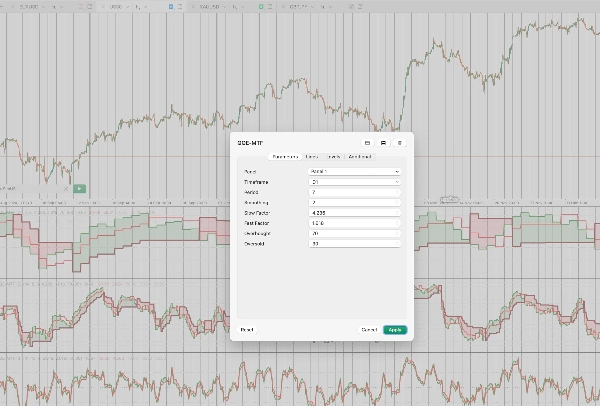
لتكوين QQE متعدد الأطر الزمنية، يجب على المتداولين اختيار:
🔹 الإطار الزمني (مثل يومي، H4، H1)
🔹 الفترات (عدد الشموع المستخدمة في الحساب)
🔹 فترة التنعيم (لتنعيم RSI)
🔹 العوامل البطيئة والسريعة (لتعديل الحساسية)
🔹 مستويات الشراء والبيع المفرط القابلة للتخصيص
📌 ملاحظة: نظرًا لأن هذا مؤشر متعدد الأطر الزمنية، بعد إضافته إلى الرسم البياني، من الضروري التكبير للخارج في واجهة cTrader للسماح بتحميل بيانات كافية وتهيئة المؤشر بشكل صحيح.
استراتيجيات التداول مع QQE متعدد الأطر الزمنية
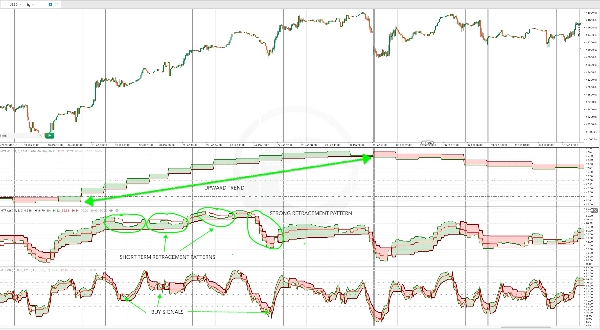
1️⃣ QQE لتأكيد الاتجاه على الإطار الزمني العالي
إحدى الطرق الفعالة لاستخدام QQE متعدد الأطر الزمنية هي لتأكيد الاتجاه على إطار زمني أعلى مع تحديد نقاط الدخول في التصحيحات على إطار زمني أدنى.
على سبيل المثال:
- يُستخدم QQE على الإطار الزمني اليومي لتأكيد اتجاه قوي.
- تُحدد نقاط الدخول في التصحيحات عندما يعبر مؤشر الاستوكاستيك مستويات الشراء أو البيع المفرط.
تساعد هذه الطريقة المتداولين على مواءمة دخولهم مع الاتجاه العام.
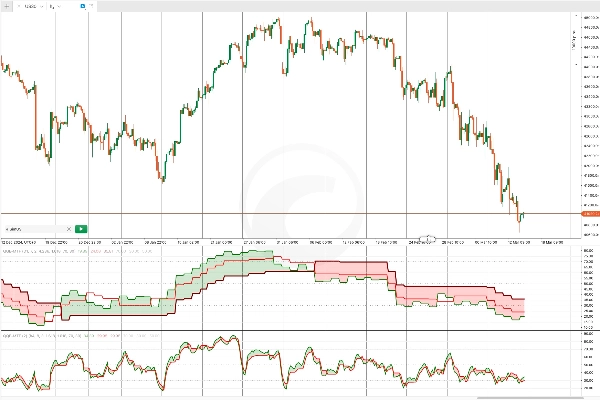
2️⃣ التحليل متعدد الأطر الزمنية لفهم أعمق للسوق
يتيح استخدام QQE عبر أطر زمنية متعددة للمتداولين فهمًا أكثر تفصيلاً لسلوك الأصل.
على سبيل المثال، من خلال تطبيق QQE على:
📊 الإطار الزمني اليومي (D1): يحدد اتجاه الاتجاه العام.
📊 الإطار الزمني 4 ساعات (H4): يؤكد اتجاه الاتجاه ويحدد التصحيحات قصيرة الأجل.
📊 الإطار الزمني ساعة واحدة (H1): يولد إشارات دخول دقيقة بناءً على حالات الشراء أو البيع المفرط أو التحركات المضادة للاتجاه.
تعزز هذه الطريقة المنظمة توقيت التداول واتخاذ القرار من خلال مواءمة الإشارات عبر أطر زمنية مختلفة.
الملخص
This advanced multi-timeframe tool integrates fast and slow trend lines to analyze price action across different timeframes, providing a comprehensive view of market trends. Its smoothing algorithm improves reliability, making it effective for identifying trend direction, generating precise entry and exit signals, and detecting overbought/oversold levels.
Users configure the indicator by selecting a timeframe (e.g., Daily, H4, H1), periods for calculation, smoothing period for RSI, sensitivity factors, and customizable overbought/oversold thresholds. It is recommended to zoom out in the cTrader interface after adding the indicator to allow sufficient data loading.
Typical strategies include using the QQE on higher timeframes for trend confirmation and on lower timeframes for entry timing, as well as multi-timeframe analysis to enhance trade timing and decision-making by aligning signals across timeframes.
تقييمات العملاء
5 | 50 % | |
4 | 50 % | |
3 | 0 % | |
2 | 0 % | |
1 | 0 % |


