
الوصف
متوسط الحركة الملون لهول – اتجاه الاتجاه بنظرة سريعة
نظرة عامة
متوسط الحركة الملون لهول هو مؤشر متابعة اتجاه مبسط يطبق استجابة متوسط الحركة لهول مع إشارات اتجاهية ملونة. من خلال عرض الاتجاهات الصاعدة باللون الأخضر والاتجاهات الهابطة باللون الأحمر، يوفر تأكيدًا بصريًا فوريًا لاتجاه الزخم دون الحاجة إلى تحليل معقد.
ما يفعله
أساس متوسط الحركة لهول: يستخدم المؤشر متوسط الحركة لهول (HMA)، وهو متوسط متحرك سريع الاستجابة مصمم لتقليل التأخير مع الحفاظ على السلاسة. على عكس المتوسطات المتحركة التقليدية، يعطي HMA أولوية لحركة السعر الأخيرة، مما يجعله مفيدًا بشكل خاص لالتقاط تغييرات الاتجاه مبكرًا.
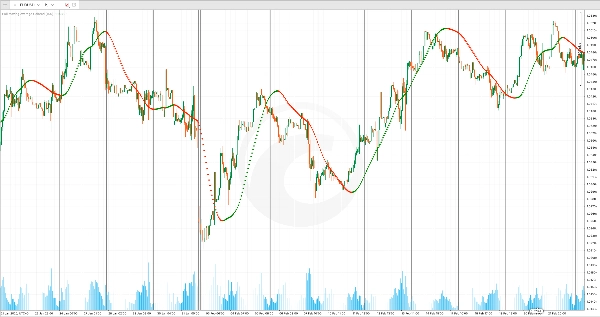
تصوير الاتجاه الملون: بدلاً من خط واحد، يرسم المؤشر نقاطًا اتجاهية:
- النقاط الخضراء: تظهر عندما يرتفع HMA، مما يشير إلى زخم صاعد
- النقاط الحمراء: تظهر عندما ينخفض HMA، مما يشير إلى زخم هابط
يجعل هذا النظام الثنائي للألوان اتجاه الاتجاه واضحًا من النظرة الأولى—لا حاجة لتفسير الميل أو المقارنة مع الأشرطة السابقة.
الميزات الرئيسية
عرض متراكب: يرسم المؤشر مباشرة على مخطط السعر الخاص بك، مما يسمح لك برؤية اتجاه الاتجاه بالنسبة لمستويات السعر الفعلية. هذا يجعل من السهل اكتشاف متى يكسر السعر فوق أو تحت المتوسط المتحرك، مما يشير إلى نقاط دخول وخروج محتملة.
تقليل التأخير الاستجابي: يتفاعل متوسط الحركة لهول بشكل أسرع من المتوسطات المتحركة الأسية أو البسيطة القياسية، مما يجعله فعالًا بشكل خاص للمتداولين المتأرجحين والمتداولين داخل اليوم الذين يحتاجون إلى إشارات في الوقت المناسب دون تقلبات مفرطة.
تخصيص بسيط: قم بضبط معامل الفترة للتحكم في الحساسية. الفترات الأقصر (مثل 20-32) تجعل المؤشر أكثر استجابة للحركات الأخيرة لكنه عرضة للإشارات الخاطئة في الأسواق المتقلبة. الفترات الأطول (مثل 64-128) توفر اتجاهات أكثر سلاسة مع عدد أقل من الاختراقات الخاطئة لكنها قد تفوت الانعكاسات السريعة.
الاستخدام العملي
استخدم متوسط الحركة الملون لهول كمرشح سريع لاتجاه التداول. قم بأخذ صفقات شراء فقط عندما تظهر النقاط الخضراء ويكون السعر فوق المتوسط؛ خذ صفقات بيع فقط عندما تظهر النقاط الحمراء ويكون السعر تحت المتوسط. وعلى العكس، اعتبر تغييرات اللون كإشارات خروج محتملة—عندما يتحول اللون من الأخضر إلى الأحمر، حان الوقت لإعادة تقييم مراكز الشراء الخاصة بك.
يعمل المؤشر جيدًا في الأسواق ذات الاتجاهات، وهو مفيد بشكل خاص على الأطر الزمنية الأعلى (4 ساعات ويومي) حيث يمكن أن يساعدك على التوافق مع الانحياز الاتجاهي الأوسع قبل التداول على إعدادات الأطر الزمنية الأدنى.
الملخص
This indicator overlays directly on price charts and uses a binary color system to indicate trend direction: green points appear when the HMA is rising, signaling upward momentum, and red points appear when the HMA is falling, signaling downward momentum. This visual approach allows traders to quickly identify trend direction without interpreting slopes or comparing previous bars.
Users can adjust the period parameter to control sensitivity—shorter periods increase responsiveness but may generate more false signals, while longer periods smooth trends but may delay signals. The indicator is suitable for various markets including Forex, indices, stocks, and cryptocurrencies such as BTCUSD and XAUUSD. It is particularly useful on higher timeframes (4-hour and daily) for aligning with broader market trends and can assist in identifying potential entry and exit points based on trend changes.
تقييمات العملاء
5 | 0 % | |
4 | 100 % | |
3 | 0 % | |
2 | 0 % | |
1 | 0 % |


