

설명
설명:
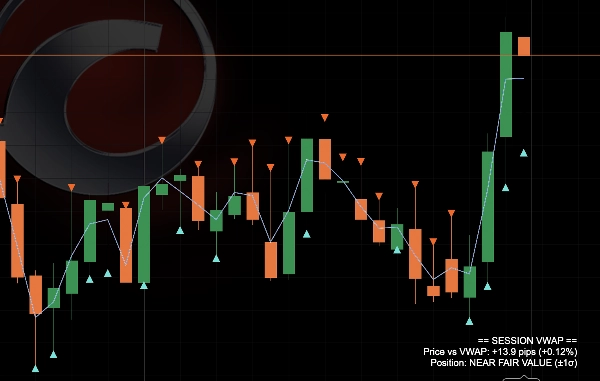
세션 VWAP 밴드 는 선택한 세션(기본값은 일일 리셋)에 고정된 거래량 가중 평균 가격을 플로팅하며, 세 가지 단계의 통계적 편차 밴드와 함께 표시됩니다 — 기관 주식 및 선물 데스크에서 사용하는 동일한 공정 가치 프레임워크를 소매 외환 및 CFD 차트에 적용한 것입니다.
분석 내용: 세션 시작부터 누적된 거래량으로 가중된 각 바의 전형적인 가격(고가+저가+종가 ÷ 3)을 분석합니다. 이를 바탕으로 실행 중인 VWAP와 그 주변 가격의 표준 편차를 도출하며, 위아래로 1σ, 2σ, 3σ 밴드를 투영합니다.
읽는 방법:
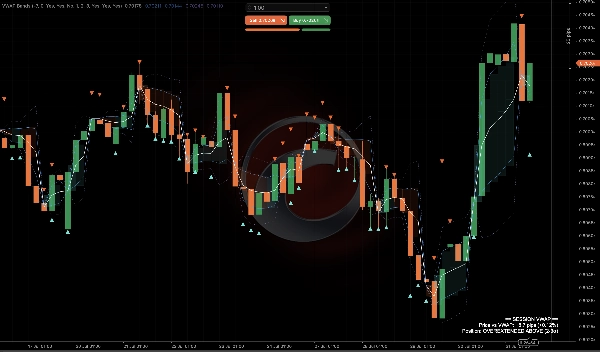
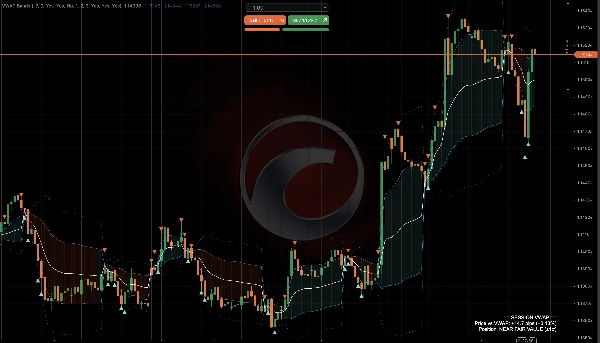
- 하얀 VWAP 선은 세션의 거래량 가중 공정 가치를 나타내며 — 가격이 이 선 위에 있으면 세션 동안 매수자가 우세하고, 아래에 있으면 매도자가 우세합니다.
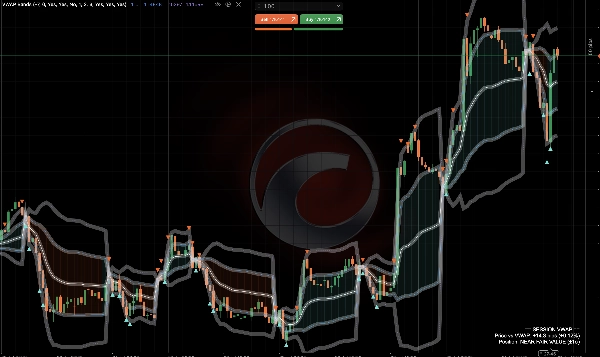
- 내부 밴드(1σ, 실선)는 공정 가치 주변의 정상 거래 범위를 표시합니다.
- 외부 밴드(2σ/3σ, 점선)는 통계적으로 확장된 구역을 표시하며 — 가격이 이 구역을 장시간 벗어나면 되돌림이 발생하거나 강한 추세 지속이 촉발될 가능성이 높습니다.
- 부드러운 그라데이션 구름은 가격과 첫 번째 밴드 사이 공간을 음영 처리하며, 가격이 VWAP의 어느 쪽에서 거래되는지에 따라 색상이 변해 세션 편향을 빠르게 시각적으로 파악할 수 있습니다.
- 가격이 두 번째 편차 밴드를 넘어 꼬리를 만들고 다시 내부에서 마감할 때마다 작은 삼각형 표시가 자동으로 나타나며 — 극단적인 지점에서 평균 회귀 가능성을 알리는 신호입니다.
- 모서리에 있는 패널은 실시간으로 평이한 영어로 읽을 수 있는 정보를 제공하며: VWAP로부터의 거리(핍 및 %), 그리고 "OVEREXTENDED ABOVE (2-3σ)"와 같은 구역 라벨을 표시합니다.
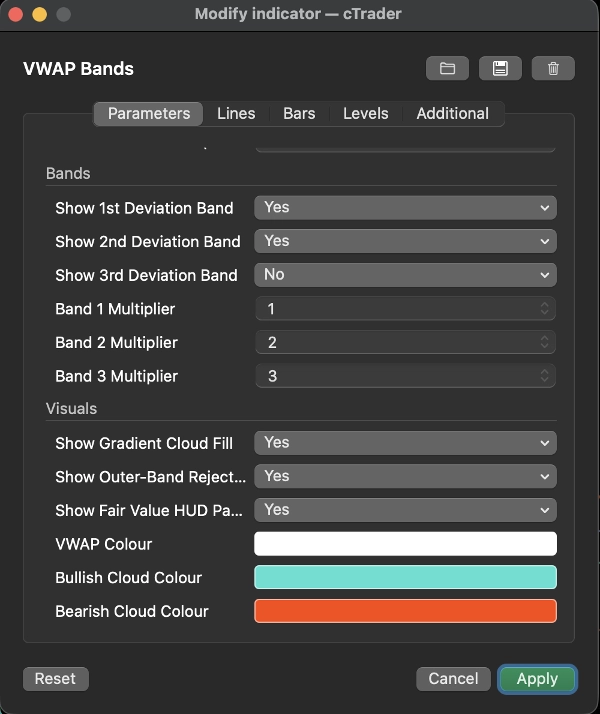
주요 설정: 세션 리셋 시간(정확한 일일 리셋을 위한 서버 시간과 뉴욕 시간 오프셋 포함), 세 가지 밴드 단계 각각에 대한 독립적인 켜기/끄기 토글 및 사용자 지정 배수, 구름 채우기 및 거부 표시 토글, 그리고 완전한 색상 사용자 지정 기능.
일반적인 사용 사례: 지수, 주요 외환, 금의 일중 공정 가치를 판단; 가격이 외부 밴드를 터치할 때 확장된 움직임을 되돌리는 전략; VWAP를 동적 일중 지지/저항으로 활용; "확장된" 또는 "공정 가치" 시작점에서 돌파가 발생하는지 확인.
적합 대상: 정적 선이 아닌 객관적이고 통계적으로 근거 있는 공정 가치 판독을 원하는 일중 및 스캘핑 트레이더에게 적합 — 재량적 편향 형성 및 다른 설정과 함께 사용하는 컨플루언스 도구로 유용합니다. 순수 장기 포지션 트레이더에게는 덜 관련성이 있습니다.
요약
AI 요약
VWAP Bands is a trading indicator that plots the volume-weighted average price (VWAP) anchored to a user-defined session, resetting daily by default. It includes three tiers of statistical deviation bands (1σ, 2σ, and 3σ) above and below the VWAP, providing a fair-value framework commonly used by institutional equity and futures traders, adapted here for retail forex, indices, and CFD markets.
The indicator calculates each bar’s typical price (average of high, low, and close) weighted by volume from the session start, deriving the running VWAP and standard deviation. The white VWAP line represents the session’s fair value, with price above favoring buyers and below favoring sellers. The inner bands mark normal trading ranges, while outer bands indicate statistically stretched price zones that often precede reversions or strong trend continuations.
Visual features include a gradient cloud shading between price and the first band, changing color based on price position relative to VWAP, and triangle markers signaling price rejection beyond the second deviation band, suggesting potential mean reversion. A corner panel displays live metrics such as distance from VWAP in pips and percentage, plus zone labels like "OVEREXTENDED ABOVE (2-3σ)."
Key settings allow customization of session reset time, band multipliers, cloud and marker toggles, and colors. VWAP Bands is suited for intraday and scalping traders seeking an objective, statistically grounded measure of fair value and dynamic support/resistance.
The indicator calculates each bar’s typical price (average of high, low, and close) weighted by volume from the session start, deriving the running VWAP and standard deviation. The white VWAP line represents the session’s fair value, with price above favoring buyers and below favoring sellers. The inner bands mark normal trading ranges, while outer bands indicate statistically stretched price zones that often precede reversions or strong trend continuations.
Visual features include a gradient cloud shading between price and the first band, changing color based on price position relative to VWAP, and triangle markers signaling price rejection beyond the second deviation band, suggesting potential mean reversion. A corner panel displays live metrics such as distance from VWAP in pips and percentage, plus zone labels like "OVEREXTENDED ABOVE (2-3σ)."
Key settings allow customization of session reset time, band multipliers, cloud and marker toggles, and colors. VWAP Bands is suited for intraday and scalping traders seeking an objective, statistically grounded measure of fair value and dynamic support/resistance.
지표 프로필
상담
고객 리뷰
0.0
리뷰: 0
고객 리뷰
이 상품에 대한 리뷰가 아직 없습니다. 이미 사용해 보셨나요? 다른 사람들에게 가장 먼저 소개해 주세요!
자주 묻는 질문(FAQ)
Flag
AI-assisted
Volume
Market Structure
Triangle
VWAP
Support & Resistance
트레이딩 봇, 지표, 플러그인 등 cTrader Store에서 제공되는 상품은 제3자 개발자에 의해 제공되며, 이는 단순히 정보 및 기술적 접근을 목적으로 제공된 것입니다. cTrader Store는 중개인이 아니며, 투자 조언, 개인별 추천 또는 향후 성과에 대한 어떠한 보장도 제공하지 않습니다.
이 작성자의 상품 더 보기






























가격

가입일 07/05/2026
6
판매
63
무료 설치