
VegaXLR - Auto Support and Resistance
Indicator
6 purchases
Version 1.0, Feb 2025
Windows, Mac
4.3
Reviews: 3
Description
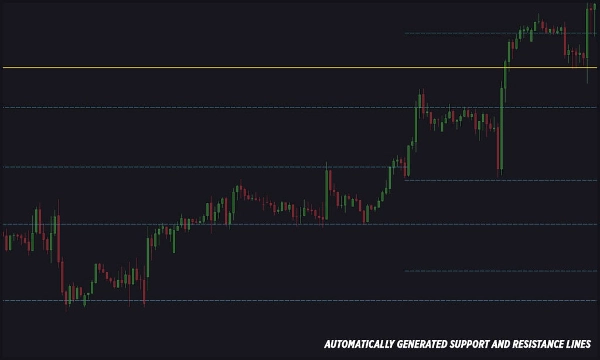
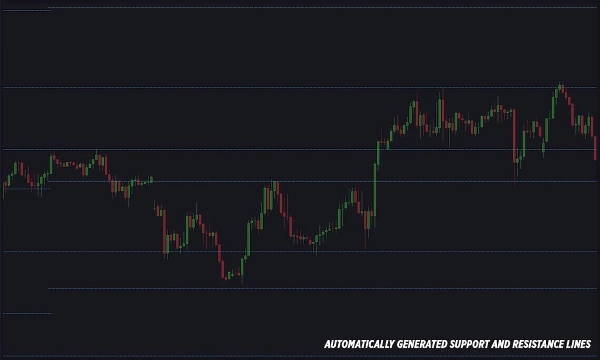
This cTrader indicator automatically draws support and resistance lines on your chart, making it easy to use for both beginners and professionals. The lines are generated based on key Fibonacci levels and price swings (zigzags).
Features:
- Automatically detects and draws support and resistance lines.
- Fully customizable line styles, thickness, and colors.
- Adjustable number of support and resistance lines.
- Alerts when price interacts with support or resistance lines.
- Multiple alert options: Telegram, Email, Pop-ups, and sounds.
- Ability to choose which Fibonacci levels generate the lines.
- Option to trigger alerts from Ask or Bid price lines.
- Configurable alert conditions: bar-close alerts or instant price-touch alerts.
- Customizable alert messages with user-defined comments.
- Option to enable alerts only for strong support and resistance levels.
- Ability to capture and send chart screenshots via Telegram (chart must be visible).
- Simple email alert setup.
- Quick access to the user guide through a small button on the chart.
Summary
AI summary
VegaXLR - Auto Support and Resistance is a cTrader indicator that automatically identifies and draws support and resistance lines on trading charts. It uses key Fibonacci levels combined with price swing analysis (zigzags) to generate these lines, aiding traders in recognizing critical price levels. The indicator offers full customization of line styles, thickness, and colors, and allows adjustment of the number of support and resistance lines displayed.
It features real-time alerts triggered when price interacts with these levels, with configurable conditions such as bar-close or instant price-touch alerts. Alert notifications can be sent via multiple channels including Telegram, Email, pop-ups, and sounds. Users can specify which Fibonacci levels to use for line generation and choose whether alerts trigger from Ask or Bid price lines. Additional options include enabling alerts only for strong levels, customizing alert messages, and capturing chart screenshots to send via Telegram.
A user guide is accessible directly from the chart for ease of use. This tool supports Forex markets and is designed to assist both beginners and professionals in technical analysis by automating the detection of key support and resistance zones.
Indicator profile
Customer reviews
4.3
Reviews: 3
5 | 67 % | |
4 | 0 % | |
3 | 33 % | |
2 | 0 % | |
1 | 0 % |
Customer reviews
March 2, 2025
Focused trade layer if the trader wants it keeps attention on levels that actually matter. It works best as support, not a final decision maker. The cleanest use is 3 to 5 levels per chart, with 0.5 pullbacks checked before entry. not every zone holds, even if it looks clean.
March 1, 2025
March 1, 2025
Balanced demo helper for traders who build plans around market levels. It gives value around key price zones, but not every zone holds, even if it looks clean. I would wait for 2 reactions and avoid trades where the target is less than 1.5R. Levels are useful when they reduce noise, not when they crowd the chart.
Discussion
FAQ
Forex
Products available through cTrader Store, including trading bots, indicators and plugins, are provided by third-party developers and made available for informational and technical access purposes only. cTrader Store is not a broker and does not provide investment advice, personal recommendations or any guarantee of future performance.


Price
231
Sales
692
Free installs