
Description
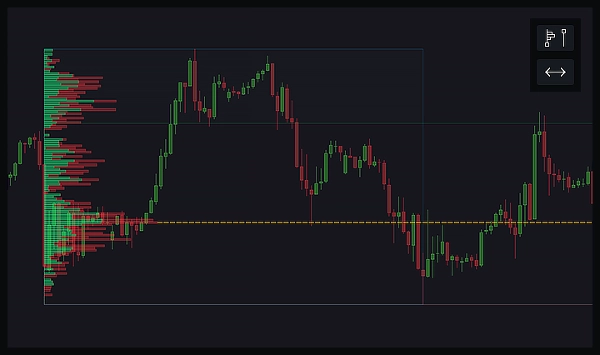
A Fixed Range Volume Profile is a tool that shows how much trading activity occurred at different price levels within a specific range on a chart. You draw a rectangle over the area you're interested in, and the profile displays horizontal bars indicating the volume of trades at each price level within that range. This helps you see where the most buying and selling happened, highlighting key price levels that might be important for making trading decisions.
Key components of the Fixed Range Volume Profile include:
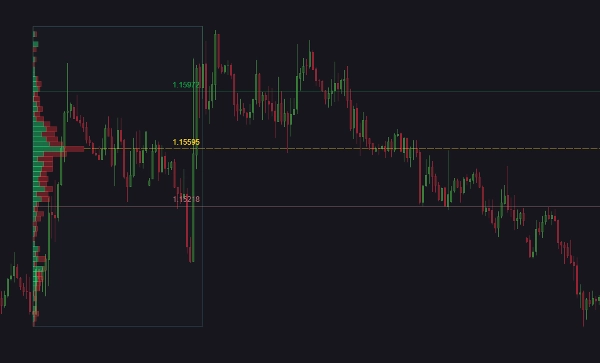
- Point of Control (POC): The price level with the highest trading volume within the selected range. This is often seen as a significant support or resistance level because it reflects a price where a lot of trading activity took place.
- Value Area High (VAH): The upper boundary of the price range where 70% of the total trading volume occurred. Prices above this level are considered less traded and potentially overvalued.
- Value Area Low (VAL): The lower boundary of the price range where 70% of the total trading volume occurred. Prices below this level are considered less traded and potentially undervalued.
These lines help traders identify significant price levels that can act as support or resistance. By understanding where the bulk of trading volume is concentrated, traders can make more informed decisions about potential price movements, entry, and exit points.
For example, if the current price is near the POC, it might indicate a strong support or resistance level. If the price is within the value area, it suggests that it is in a fair value range, while prices outside the value area might be seen as potential breakout or breakdown points.
What this Indicator Does:
This indicator enhances your trading chart with powerful volume profile analysis and customizable alerts. With two intuitive buttons, you can easily draw fixed range volume profiles and expand or contract key levels to infinity. The volume profile can be visualized in two different modes, total or up and down bars. Adjust the number of levels, data resolution (Precise or Fast), and the size of the value area to suit your needs.
Magnetic ranges automatically update based on the last candle, ensuring your analysis stays current. You can also customize the appearance and behavior of the profile and its components, including POC, VAH, and VAL lines. Alerts can be set for price touches, with options to trigger actions like starting or stopping cBots, and closing positions. Alerts can be delivered via sound, cTrader pop-ups, Telegram messages (with optional screenshots), and emails.
Features:
- Fixed Range Volume Profile: Draw a rectangle to visualize the volume profile of a selected range.
- Expand/Contract Lines: Extend or contract POC, VAH, and VAL lines to infinity.
- Volume Profile Modes: Choose between total volume or up and down bars.
- Customizable Levels and Resolution: Select the number of levels and resolution (Precise or Fast).
- Adjustable Value Area: Set the size of the value area.
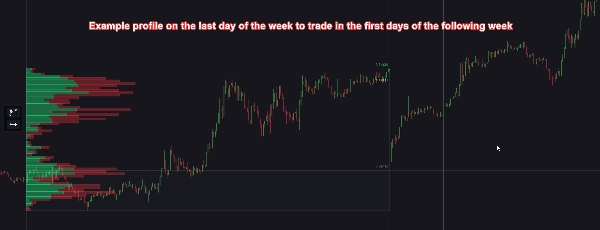
- Magnetic Ranges: Automatically resize ranges to align with the last candle, updated every 1–10 minutes or on bar close.
- Customizable Appearance: Change the position, size, and style of buttons, lines, and volume bars.
- Alerts for Price Touches: Get notified when price touches POC, VAH, or VAL lines.
- cBot Integration: Start or stop cBots based on alerts.
- Position Management: Close positions when alerts occur, with customizable options for each line (POC, VAH, and VAL).
- Alert Methods: Receive alerts via sound, cTrader pop-ups, Telegram messages (with optional screenshots), and emails.
- Performance Optimization: Option to auto-delete past ranges not visible on the chart to improve performance.
- Global Alert Control: Easily enable or disable all alerts from this indicator.
- User Guide: You can easily open the user guide of this indicator through a small button on the chart.
Summary
The indicator offers two visualization modes: total volume or separate up and down volume bars. It features customizable settings for the number of volume levels, data resolution (Precise or Fast), and value area size. Magnetic ranges automatically update based on the latest candle to keep analysis current. Users can expand or contract POC, VAH, and VAL lines infinitely.
Alerts can be configured for price touches on these key levels, with notifications via sound, platform pop-ups, Telegram (including optional screenshots), and email. Alerts can trigger actions such as starting/stopping cBots or closing positions. The indicator also supports customizable appearance, performance optimization by auto-deleting out-of-view ranges, and global alert control. A user guide is accessible directly from the chart interface.
Customer reviews
5 | 67 % | |
4 | 0 % | |
3 | 33 % | |
2 | 0 % | |
1 | 0 % |


