
Description
🎯 MULTI-TIMEFRAME VOLATILITY INTELLIGENCE
Stop Missing Volatility Breakouts - See Every Timeframe Simultaneously
Most volatility indicators show you only one perspective. Our Multi-Timeframe Rolling Volatility Indicator gives you the complete picture across short-term (7), medium-term (21), and long-term (63) periods - with built-in trading signals that tell you exactly when to act.
⚡ WHY MULTI-TIMEFRAME VOLATILITY CHANGES EVERYTHING
Single Timeframe vs Our Multi-Timeframe Approach:
- ❌ Single Period: You see trees but miss the forest
- ✅ Three Periods: Complete volatility landscape with context
Real Trading Scenarios:
- Short-term spike while long-term calm → Temporary noise (ignore)
- All timeframes rising → Genuine regime change (act)
- Short-term calm amid long-term chaos → False calm (caution)
🎯 PROFESSIONAL FEATURES
✨ TRIPLE TIMEFRAME VISIBILITY
- StdDev 7: Catch immediate volatility shifts (intraday)
- StdDev 21: Medium-term volatility (swing trading)
- StdDev 63: Long-term volatility context (position trading)
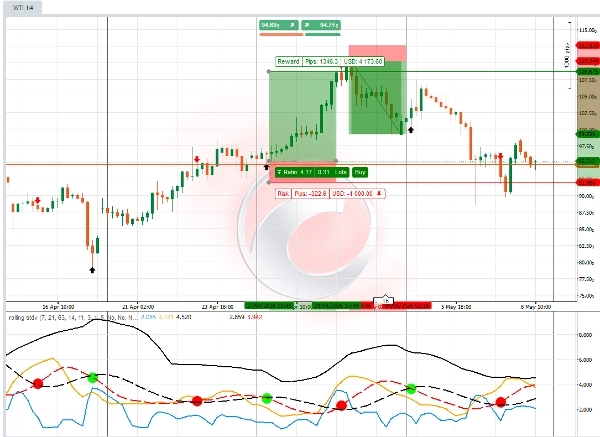
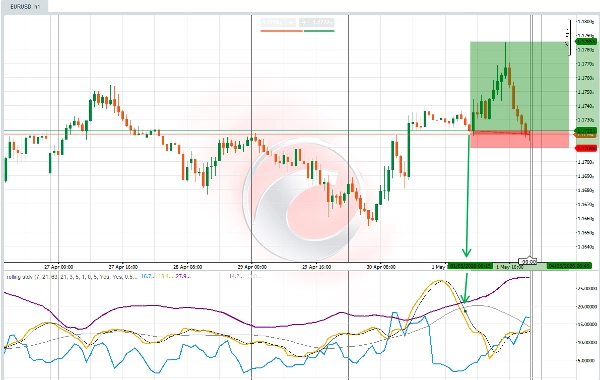
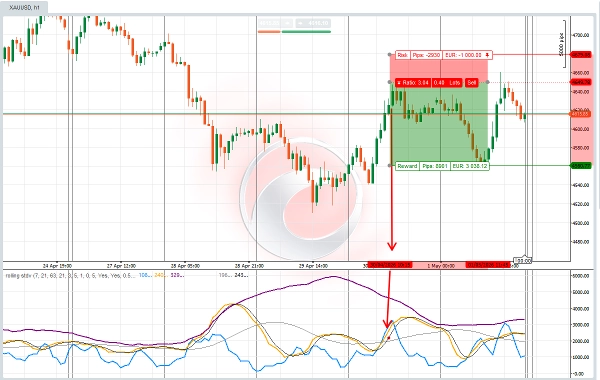
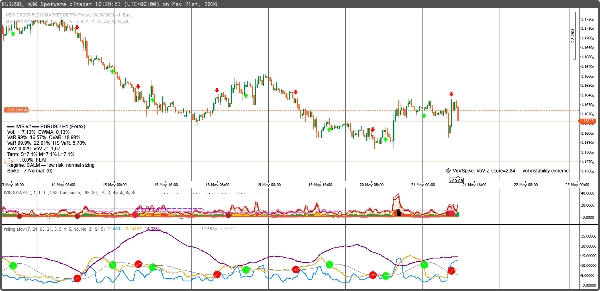
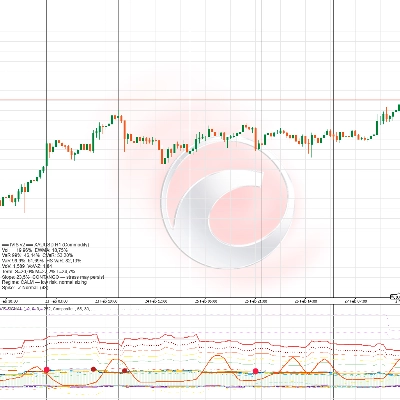
- Oscillator signal: when the average Rolling Standard Deviation signal lines cross, which coloured Dots confirm higher and lower volatility and price action direction. With a large Red-DOT, Green-DOT signal, the Trader will also see a Red-Arrow, Green-Arrow signal on the chart, that can help to decide entry levels and the size of the trade.
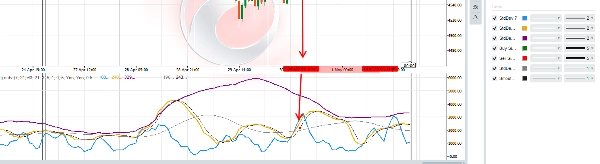
- Rolling Standard Deviation is a volatility oscillator with predictive market signal logic. Parameters on the panel have to be checked and adapted to the type of CFD instrument the trader wants to trade. Every Financial Asset CFDs instrument can have slightly different on-panel settings. Traders can choose the accuracy and precision of volatility readings, with activating: Slope, Fast/Mid cross signal, and Smoothing.
📊 ADVANCED VOLATILITY ANALYSIS
- Volatility Crossovers: StdDev lines crossing = regime changes
- Mean Reversion Signals: Volatility returning to average
- Spike Detection: Extreme volatility events
💡 PERFECT FOR THESE TRADING STYLES:
🎯 Volatility Breakout Traders
- Enter during low volatility before explosive moves
- Exit during high volatility before reversals
- Time entries with precision using triple confirmation
📈 Mean Reversion Traders
- Fade volatility extremes with confidence
- Identify overextended market conditions
- Use volatility as a contrarian indicator
🛡 Risk-Averse Traders
- Avoid high volatility periods entirely
- Trade only during calm, predictable markets
- Use volatility as a position sizing guide
📊 Options Traders
- Time premium selling during high volatility
- Buy options during volatility compression
- IV vs HV analysis for mispricing
Built-In Smart Signals:
- ✅ Buy when: Volatility drops below threshold OR crosses below moving average
- ✅ Sell when: Volatility spikes above threshold OR crosses above moving average
📈 WHAT YOU GET:
✅ Triple Timeframe Visibility - No more guessing volatility context
✅ Automated Buy/Sell Signals - Clear visual arrows at optimal points
✅ Volatility Regime Detection - Know when markets are calm or chaotic
✅ Customizable Thresholds - Adapt to any trading style or asset
✅ Professional Colour Coding - Instant visual understanding
💰 SPECIAL LAUNCH PRICING: $50
(Regular price: $100)
Value Breakdown:
- StdDev 7 Indicator: $29 value
- StdDev 21 Indicator: $29 value
- StdDev 63 Indicator: $29 value
- Trading Signals: $49 value
- Total Value: $136
- Your Price: $50 (Save 35%)
Included: Full indicator Colour
🎁 BONUS: Free Volatility Timing Guide
Purchase includes "Multi-Timeframe Volatility Mastery" - a $39 value FREE.
Includes:
- Volatility compression trading strategies
- Multi-timeframe confirmation techniques
- Risk management for volatile periods
- Real-world trade examples
🚀 READY TO MASTER VOLATILITY TIMING?
Click "Add to Cart" and transform how you see and trade market volatility.
"I've tried every volatility indicator out there. This triple timeframe approach with built-in signals is what I use daily in my prop firm trading."
- Sarah Rodriguez, Professional Swing Trader
PERFECT FOR THESE MARKETS:
📊 Stocks & ETFs
- SPY, QQQ volatility timing
- Sector rotation based on volatility
- Earnings volatility plays
💹 Forex Pairs
- Major pairs volatility analysis
- Carry trade risk assessment
- Breakout confirmation
📈 Commodities
- Gold volatility cycles
- Oil volatility spikes
- Agricultural seasonal volatility
🔄 Cryptocurrencies
- BTC/ETH volatility regimes
- Altcoin volatility opportunities
- Risk management in crypto
Bottom Line: This isn't just another standard deviation indicator. It's a complete volatility timing system that shows you exactly when markets are about to move.
Limited Launch Offer: First 150 copies at $89 (save $30)
"The difference between amateur and professional trading often comes down to volatility timing. This indicator closes that gap."
Add to Cart Now → Start Trading Volatility Like a Pro.
Summary
Key features include:
- Triple timeframe visibility for immediate, swing, and position trading contexts.
- Volatility crossovers signaling regime shifts.
- Mean reversion and spike detection for volatility extremes.
- Customizable parameters to adapt to different CFD instruments and trading styles.
- Professional color-coded signals for quick interpretation.
This indicator suits various trading styles, including volatility breakout, mean reversion, risk-averse, and options trading. It supports multiple markets such as stocks, ETFs, forex pairs, commodities, and cryptocurrencies, providing volatility timing insights for assets like SPY, QQQ, gold, oil, BTC, and ETH.
Included with the indicator is a volatility timing guide covering compression strategies, multi-timeframe confirmation, risk management, and real trade examples. The tool requires tick data and outputs actionable signals to enhance volatility-based trading decisions.
Customer reviews
5 | 50 % | |
4 | 50 % | |
3 | 0 % | |
2 | 0 % | |
1 | 0 % |


!["[Stellar Strategies] Smart ADX" logo](https://cdn.ctrader.com/image/webp/af13b084-b6f6-41db-b7bc-c7e688b57b05_36929)


