
Description
CVD ai
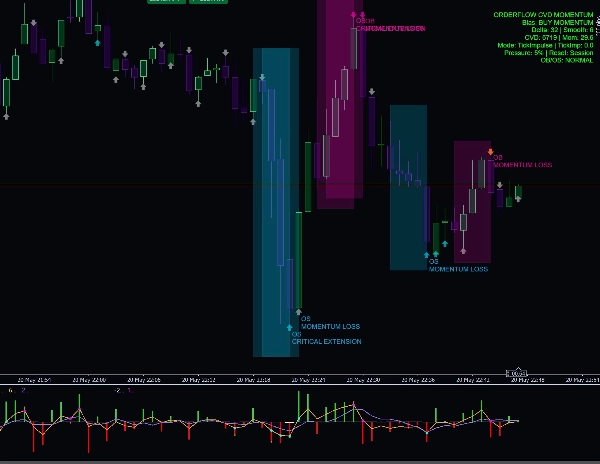
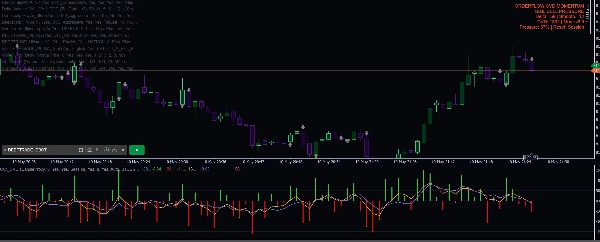
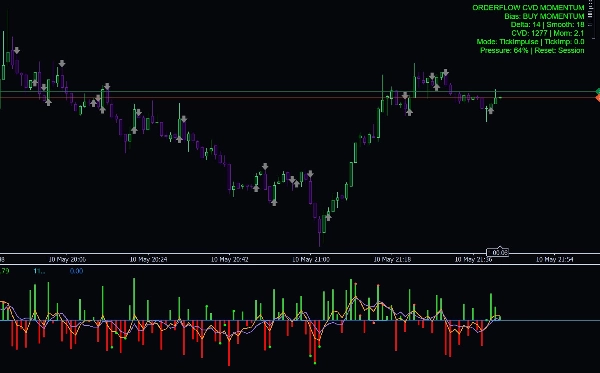
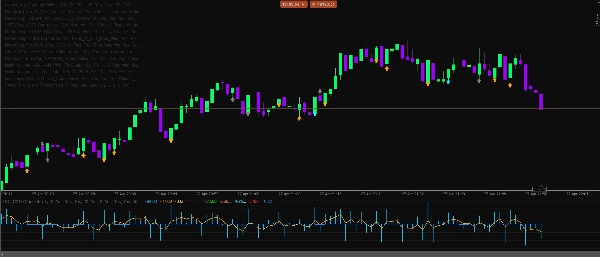
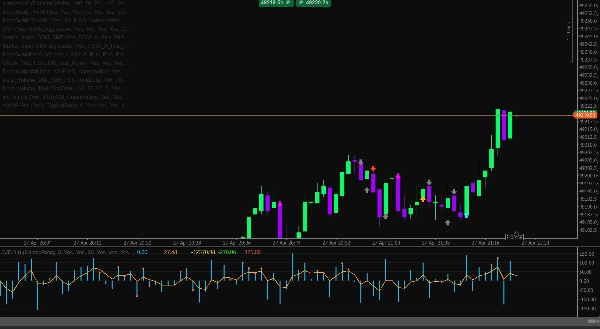
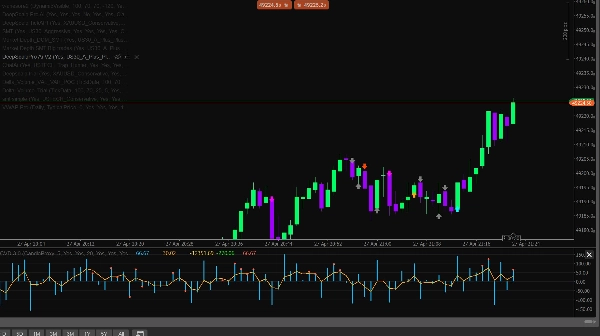
Delta CVD Advanced is a professional momentum and order analysis indicator designed for traders who want a clearer view of buying and selling pressure directly from market behavior. It combines Delta, CVD, live tick momentum, absorption, divergence, session filters, volatility guards, and a smart confluence engine into one clean analytical tool.
This indicator is built for scalping, intraday trading, and short-term momentum confirmation across Forex, Gold, Indices, Crypto, and Oil markets.
Key Features
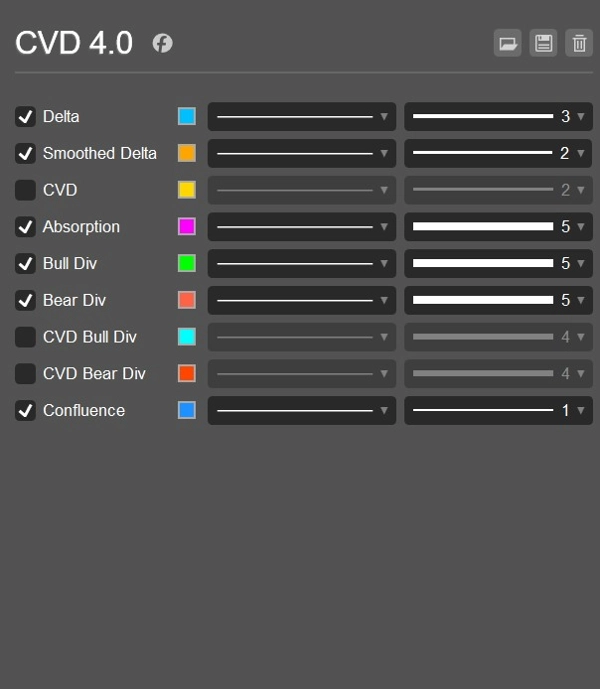
- Live Delta calculation using uptick/downtick logic
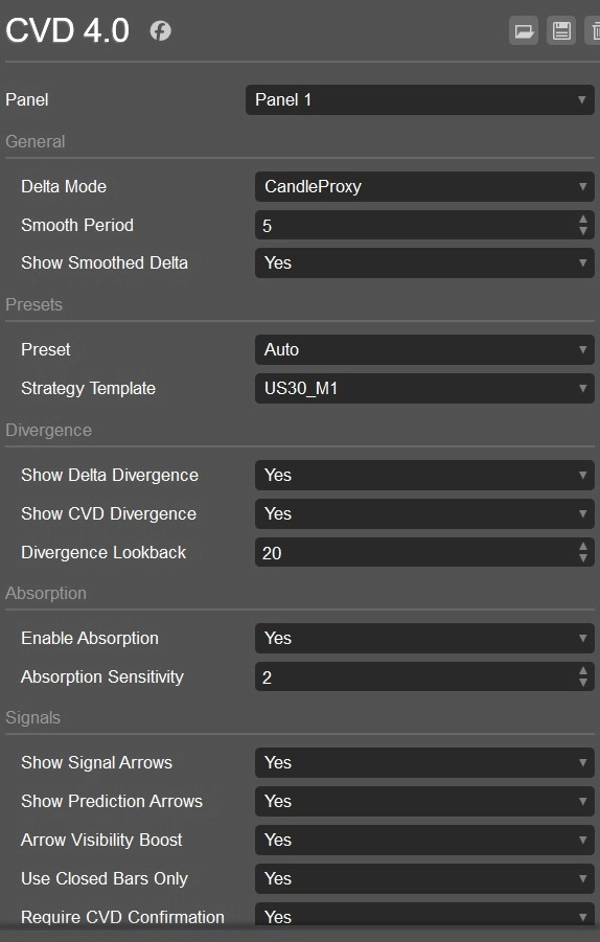
- Candle proxy delta mode for historical analysis
- Cumulative Volume Delta line to track pressure over time
- Smoothed Delta line for cleaner momentum reading
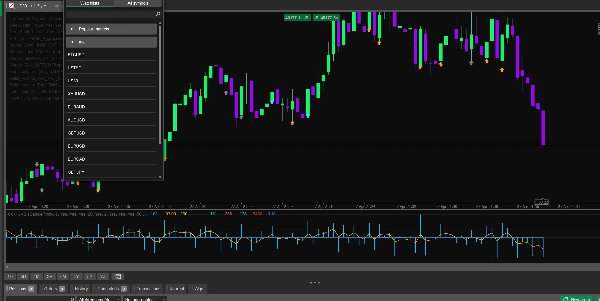
- Buy/Sell colored Delta histogram
- Tick-based momentum calculation for live market impulse
- Hybrid momentum mode combining CVD slope and tick impulse
- CVD reset options: Never, Daily, or by Session
- Bullish and bearish Delta divergence detection
- Bullish and bearish CVD divergence detection
- Absorption detection for spotting pressure that fails to move price
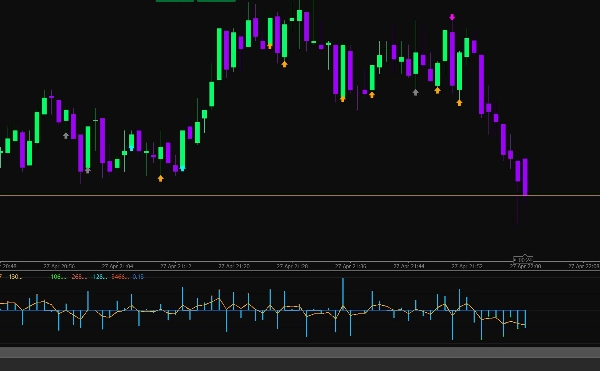
- Signal arrows for BUY and SELL opportunities
- Prediction arrows for early momentum shift warnings
- Optional CVD confirmation for signals
- Smart confluence engine with directional scoring
- DOM proxy pressure filter
- Sweep detection filter for liquidity grabs
- Session filters for Asia, London, and New York
- Automatic session detection using UTC time
- Volatility guard using ATR limits
- Spread guard to avoid poor market conditions
- Volume ratio filter to avoid weak low-volume signals
- Symbol presets for Forex, Gold, Indices, Crypto, and Oil
- Strategy templates for US30 M1, USTECH M1, XAUUSD M1, BTCUSD M1, and Oil M1
- Info dashboard showing bias, Delta, Smoothed Delta, CVD, Momentum, pressure percentage, and reset mode
- Optional log alerts with cooldown control
Why Traders Use It
Delta CVD Advanced helps traders understand who is currently in control: buyers or sellers. Instead of relying only on price candles, the indicator analyzes the pressure behind the move. This makes it useful for confirming entries, avoiding weak signals, identifying reversals, spotting absorption, and detecting momentum shifts before they become obvious on price.
The tick momentum mode is especially useful for live scalping because it reacts to real-time price impulses, while the CVD and smoothed delta tools help confirm whether the move has real strength behind it.
Best Used For
- Scalping
- Intraday trading
- Momentum confirmation
- Reversal confirmation
- Liquidity sweep analysis
- Delta and CVD divergence trading
- Gold, Indices, Crypto, Oil, and Forex pairs
- M1, M5, and other lower timeframes
Important Notice
This indicator is an analytical decision-support tool. It does not guarantee profits and should be used together with proper risk management, market structure, and a tested trading plan.
Summary
Additional functionalities include detection of bullish and bearish Delta and CVD divergences, absorption detection to identify pressure that fails to move price, and signal arrows for buy/sell opportunities alongside prediction arrows for early momentum shifts. It incorporates session filters for Asia, London, and New York trading sessions, volatility and spread guards, volume ratio filters, and a smart confluence engine with directional scoring.
CVD Ai supports markets such as Forex, Gold, Indices, Crypto, and Oil, and is optimized for scalping, intraday trading, and short-term momentum confirmation on lower timeframes like M1 and M5. It offers strategy templates for specific symbols including US30, USTECH, XAUUSD, BTCUSD, and Oil. The indicator includes an info dashboard displaying bias, Delta, smoothed Delta, CVD, momentum, pressure percentage, and reset mode options.
Customer reviews
5 | 0 % | |
4 | 100 % | |
3 | 0 % | |
2 | 0 % | |
1 | 0 % |


