
Description
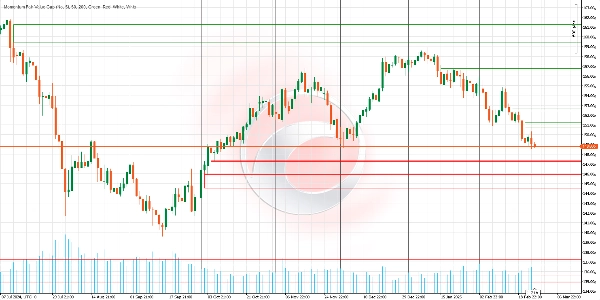
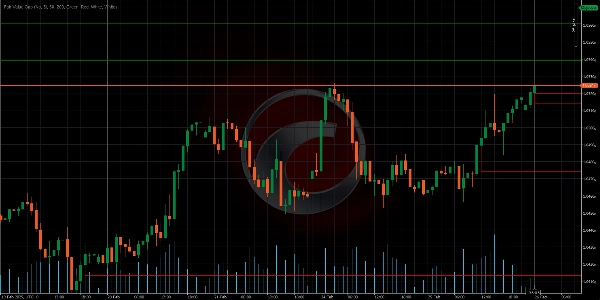
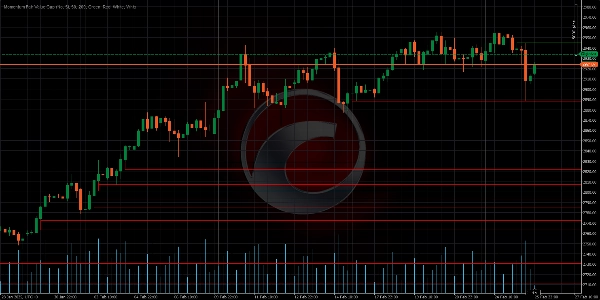
It identifies areas of market imbalance (Fair Value Gaps or FVGs) and projects them on the chart in a smart way. Unlike other indicators, this one adapts in real-time to price action, adjusting its size, persistence, and relevance. It's ideal for traders seeking clear targets and advanced visual gap management.
✨ KEY FEATURES
- Dynamic Gap Adjustment
Logic: If the price partially touches an FVG (e.g., grazes the lower boundary), the indicator automatically resizes the gap to reflect only the uncovered area.
Benefit: Avoids false signals and keeps only gaps with real potential active. - MidPoint Fill
Logic: Draws a line at the center of the gap. If the price touches it, the FVG is considered "filled" and can be removed (configurable).
Benefit: Requires only 50% contact to confirm closure, filtering noise and premature trades. - Infinite Projection Until Filled
Logic: Gaps extend into the future indefinitely (they don't disappear after X candles).
Benefit: Provides persistent reference until the market resolves the imbalance. - Automatic Cleanup of Invalidated Gaps
Logic: Automatically removes old gaps when they are fully filled.
Benefit: Keeps the chart clean and focused on active zones. - Advanced Visual Customization
Options: Different colors for bullish (green) and bearish (red) gaps. Transparency adjustment to avoid chart clutter.
Benefit: Adapts to any trading style or visual strategy.
🎯 HOW TO USE IT IN TRADING?
Identification of Key Zones:
- Bullish FVG (Green): Area where buyers temporarily lost strength.
→ Strategy: Look for buying opportunities during pullbacks to this zone. - Bearish FVG (Red): Area where sellers were overtaken.
→ Strategy: Look for selling opportunities during rallies to this zone.
Interaction with Price:
- If the gap adjusts dynamically (reduces its size), it indicates that the market is testing the zone but without confirmation.
- If the gap is removed (by full fill or MidPoint), consider the imbalance corrected.
🔍 CONFIRMATION WITH OTHER TOOLS
Combine FVGs with supports/resistances, volume, or RSI to filter signals.
📋 FEATURE COMPARISON
___________________________________________________________________________________
Feature Momentum Fair Value Gap Traditional Indicators
________________________________________________________________________________
Persistence---------------- Extends gaps until filled ----------------------- Disappear after X candles
Closure Precision-------- 50% confirmation option --------------------- Requires full gap fill
Flexibility ------------------ Resizes with price ------------------------- Static and immutable levels
Visual Focus---------------- Removes irrelevant gaps ----------------------- Clutters chart with past data
📝 PRACTICAL EXAMPLE
Scenario in EURUSD (1H):
A Bullish FVG (green) forms after a pronounced bearish candle. Days later, the price retraces, touching the lower boundary of the gap but doesn’t fill it. The indicator automatically reduces the gap size. Finally, the price touches the MidPoint (centerline), triggering its removal. The trader goes short after confirming rejection in the zone.
Ctrader Store indicators:
Dynamic Market Structure
Analysis of Turning Points
Fibonacci Linear
Regression Multi-timeframe
Multi-Level Candle Bias
Tracker
Auto Support and
Resistance Trend Lines
Summary
Key features include:
- Dynamic Gap Adjustment: Automatically resizes gaps when price partially touches them, reducing false signals.
- MidPoint Fill: Marks the gap centerline; if price touches it, the gap is considered filled and can be removed, requiring only 50% contact for confirmation.
- Infinite Projection: Gaps extend indefinitely until filled, maintaining persistent market imbalance references.
- Automatic Cleanup: Removes fully filled gaps to keep charts focused on active zones.
- Advanced Visual Customization: Uses distinct colors for bullish (green) and bearish (red) gaps with adjustable transparency.
In trading, bullish FVGs indicate zones where buyers lost strength, suggesting buying opportunities on pullbacks; bearish FVGs mark where sellers were overtaken, indicating selling opportunities on rallies. The indicator’s dynamic interaction with price helps confirm market imbalance resolution.
It is recommended to combine this indicator with other tools like support/resistance levels, volume, or RSI for signal filtering.
Customer reviews
5 | 0 % | |
4 | 100 % | |
3 | 0 % | |
2 | 0 % | |
1 | 0 % |


