
Description
Index Hunter: Overview
Index Hunter is a specialized technical indicator and decision-support system designed primarily for high-volatility indices like US30 (Dow Jones) and NAS100 (Nasdaq). Unlike standard indicators that just show past data, Index Hunter focuses on "Vector Prediction"—attempting to project where price is likely to be 4 candles into the future based on current velocity (slope) across multiple timeframes.
1. Core Mechanics (How it Works)
A. The "Vector" Forecast Engine
This is the heart of the tool. It doesn't just look at the current price; it calculates the rate of change (Slope) across the M5, M15, and H1 timeframes to draw a "Future Path" on your chart.
- Mechanic: It computes a weighted average of momentum from different timeframes to project 4 points (P1, P2, P3, P4) into the future.
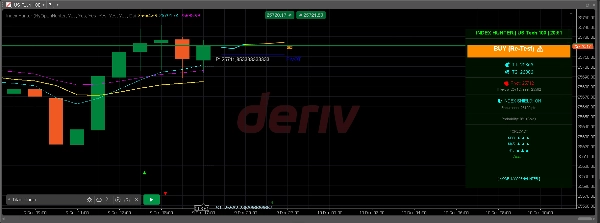
- Visual: You see a colored path (Cyan -> Yellow -> Orange) extending to the right of the price, visualizing the inertia of the market.
- Ghost Path: It also remembers the previous prediction (Ghost Path) so you can see if the market is respecting the algorithm's past projections (a "reality check").
B. Multi-Layer Visual System
It overlays critical institutional levels automatically:
- Pivot Points (Flexible): Automatically calculates Pivot, R1/S1, and R2/S2 levels based on a selectable timeframe (H12, Daily, Day2, or Day3).
- Psychological Levels: Draws "Psych Lines" at every 100-point interval (e.g., 34000, 34100), which often act as magnetic zones for indices.
- Daily High/Low: Marks the previous day's range to show breakout or rejection zones.
- Fractals: Identifies local tops and bottoms with arrows (▲ ▼) for precise entry/stop-loss placement.
C. "Confidence" & Feasibility Logic
The tool doesn't just give a signal; it grades it.
- Calculation: It measures the distance to your profit target and compares it against the market's current energy (ATR - Average True Range).
- Output:
- HOT (>80%): Strong momentum + Reasonable target distance.
- WARM (50-80%): Moderate setup.
- COLD (<50%): Market assumes low probability of reaching the target (e.g., target is too far for current volatility).
D. Account "Shield" Mechanics
It includes a passive risk manager on the panel:
- Endurance Metric: Calculates how many "points" the market can move against you before your account is in danger, based on your balance and minimum lot size.
- Status: Displays "🛡️ INDEX SHIELD: ON" if your account is safe relative to current volatility (ATR), or "⚠️ LOW MARGIN" if volatility is too high for your balance.
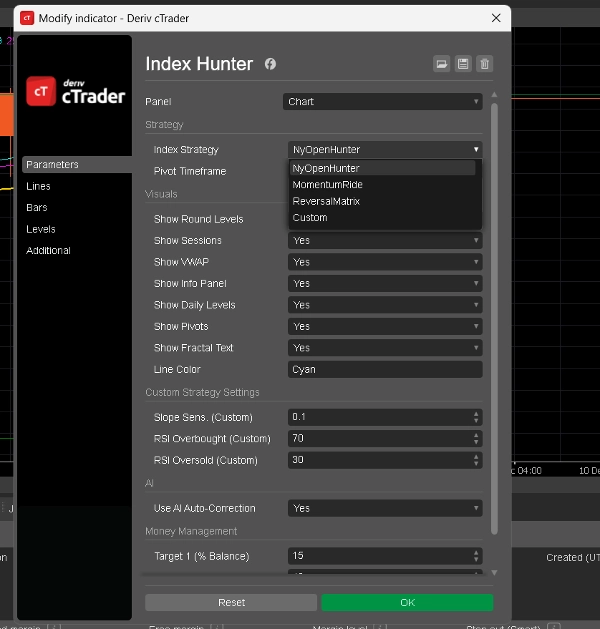
2. Available Modes (Strategies)
You can switch between these modes in the indicator settings (
Index Strategy
parameter). Each mode changes how the AI interprets the market.
1. Mode: NyOpenHunter (New York Scalper)
- Best For: The chaotic first 2-3 hours of the US Market Open.
- Logic:
- Active Time: 13:00 - 17:00 UTC (approx).
- Trigger: It looks for an M5 Slope greater than 0.1 (or less than -0.1).
- Philosophy: "Catch the explosion." It waits for the initial burst of volume at the NY bell and signals to ride that specific wave.
- Panel Sentiment: Shows "NY OPEN BUY 🚀" or "NY OPEN SELL 🔻".
2. Mode: MomentumRide (Trend Follower)
- Best For: Strong, sustained trends outside of the open.
- Logic:
- Trigger: Requires a stronger M5 Slope (> 0.2) than the NY mode.
- Philosophy: "Don't get chopped." It ignores weak movements and only signals when the market is moving with significant conviction.
- Panel Sentiment: Shows "MOMENTUM UP 🟢" or "MOMENTUM DOWN 🔴".
3. Mode: ReversalMatrix (Counter-Trend)
- Best For: Ranging markets or catching tops/bottoms.
- Logic:
- Trigger: Uses RSI (Relative Strength Index).
- Sell Signal: RSI > 75 (Overbought).
- Buy Signal: RSI < 25 (Oversold).
- Philosophy: "Fade the extremes." It identifies when the rubber band is stretched too far and is likely to snap back.
- Panel Sentiment: "OVERBOUGHT (SELL SOON)" or "OVERSOLD (BUY SOON)".
4. Mode: Custom (User Defined)
- Best For: Advanced users who want to tune the bot.
- Logic: Allows you to set your own thresholds for Slope Sensitivity and RSI levels in the settings.
- Example: You can create a hybrid strategy that only buys if Slope > 0.05 AND RSI < 40.
3. The "Info Panel" (Heads-Up Display)
The visual panel on the right side of the chart consolidates all this data:
- Header: Shows the current mode and symbol.
- Preference: The main AI bias (e.g., "BUY 34150 ▲").
- Targets (T1, T2): Dynamic profit targets calculated based on your account percentage settings and volatility.
- Forecast: A sequential analysis of M30, M45, and H1 trends (e.g., "M30: ▲ ▲ ▲" means strong buy alignment).
- Probability: The AI's confidence score (Hot/Warm/Cold).
Summary
Key features include an automatic overlay of institutional levels such as pivot points (with selectable timeframes), psychological price levels at 100-point intervals, previous day’s high/low, and fractals marking local tops and bottoms. It incorporates a confidence grading system (Hot, Warm, Cold) based on momentum strength and volatility relative to profit target distance.
Index Hunter includes a risk management "Shield" that assesses account safety by calculating potential adverse market moves against account balance and lot size, displaying status alerts accordingly.
The indicator offers four operational modes: NyOpenHunter (New York market open scalping), MomentumRide (trend following), ReversalMatrix (counter-trend using RSI), and a Custom mode for user-defined slope and RSI thresholds. A comprehensive info panel consolidates mode, bias, dynamic targets, trend forecasts, and confidence scores for decision support.
Customer reviews
5 | 67 % | |
4 | 33 % | |
3 | 0 % | |
2 | 0 % | |
1 | 0 % |


!["[Stellar Strategies] Inside Bar with Signals" logo](https://cdn.ctrader.com/image/webp/1d9e8bfa-3b2c-4440-bb37-5856902008a7_30683)


