

present
Sign up and get $50 off your first purchase
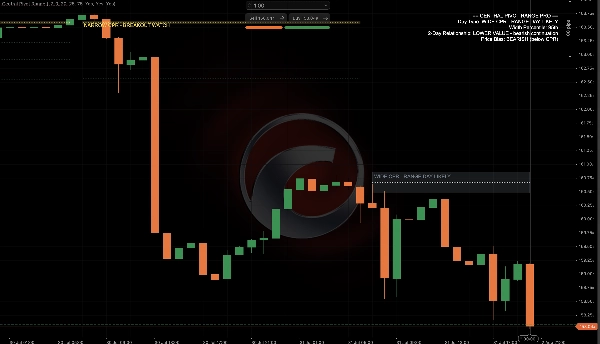
Trading product for Central Pivot Range Indicator Key Levels AI-assisted, image 1
Central Pivot Range
Indicator
Version 1.0, Aug 2026
Windows, Mac
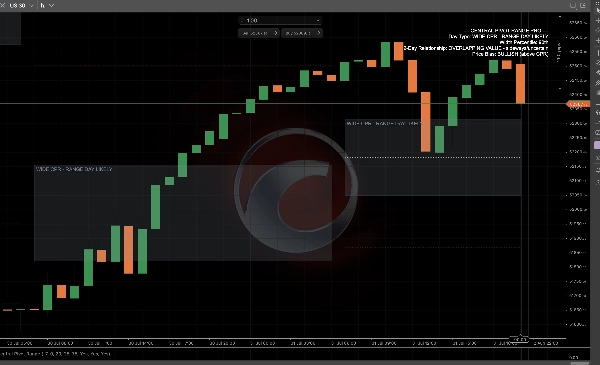
Trading product for Central Pivot Range Indicator Key Levels AI-assisted, image 2
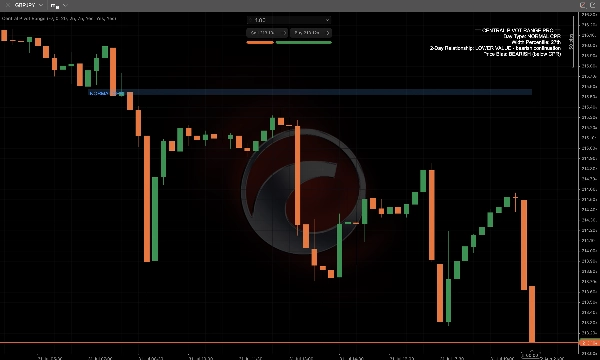
Trading product for Central Pivot Range Indicator Key Levels AI-assisted, image 3
Trading product for Central Pivot Range Indicator Key Levels AI-assisted, image 4
Trading product for Central Pivot Range Indicator Key Levels AI-assisted, image 5
Trading product for Central Pivot Range Indicator Key Levels AI-assisted, image 6
Trading product for Central Pivot Range Indicator Key Levels AI-assisted, image 7
Since 07/05/2026
5
Sales
63
Free installs

Description

Central Pivot Range (CPR) is one of the most widely used intraday tools among professional day traders, but most CPR indicators just draw three lines and stop there. Central Pivot Range Pro implements the actual CPR theory professional traders use to read the day *before* it happens — not just the levels themselves.


**What it analyses:** the prior session's high, low, and close to build today's Pivot, Top Central Pivot (TC), and Bottom Central Pivot (BC), then layers two statistical reads on top that plain CPR plotters don't have:


- **CPR Width Percentile** — today's CPR width is ranked against its recent history. A narrow CPR (bottom percentile) statistically precedes trend and breakout days; a wide CPR (top percentile) precedes range-bound, choppy days. The indicator tells you which one you're looking at before the session even develops.

- **2-Day CPR Relationship** — classifies today's CPR against yesterday's using the full professional framework: **Higher Value** (bullish continuation), **Lower Value** (bearish continuation), **Unchanged Value** (trend continuation, low volatility), **Inside Value** (choppy, range-bound), **Outside Value** (volatile, reversal risk), or **Overlapping** (sideways/uncertain). Each has a distinct, well-documented market implication.


**How to read it:**

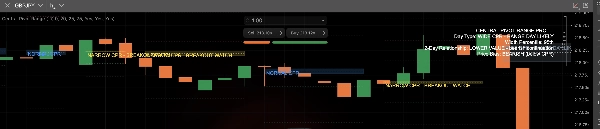
- The shaded CPR box is colour-graded: **gold** means a narrow CPR (breakout watch), **grey-blue** means a wide CPR (range day likely), **blue** is a normal-width day.

- Standard S1-S3/R1-R3 pivot levels plot as a secondary reference layer, toggleable independently.

- A live HUD panel gives you the plain-English read: day type, width percentile, 2-day relationship, and whether price is currently trading bullish (above CPR), bearish (below CPR), or neutral (inside CPR).


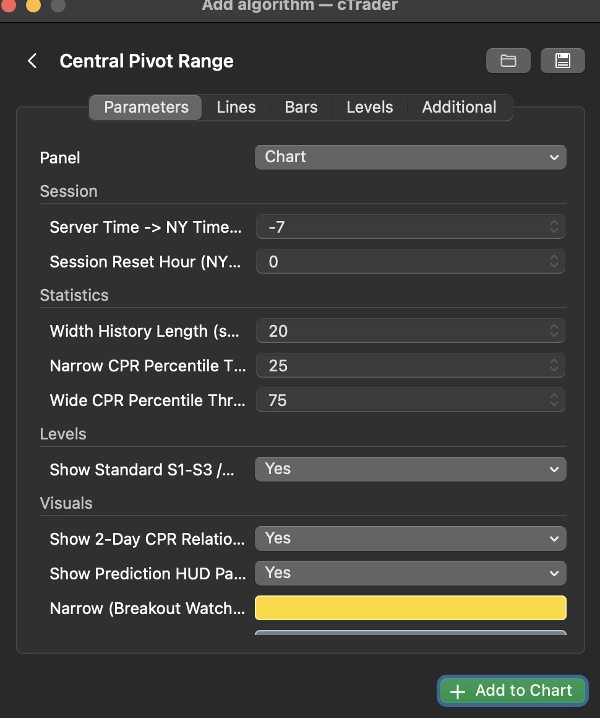
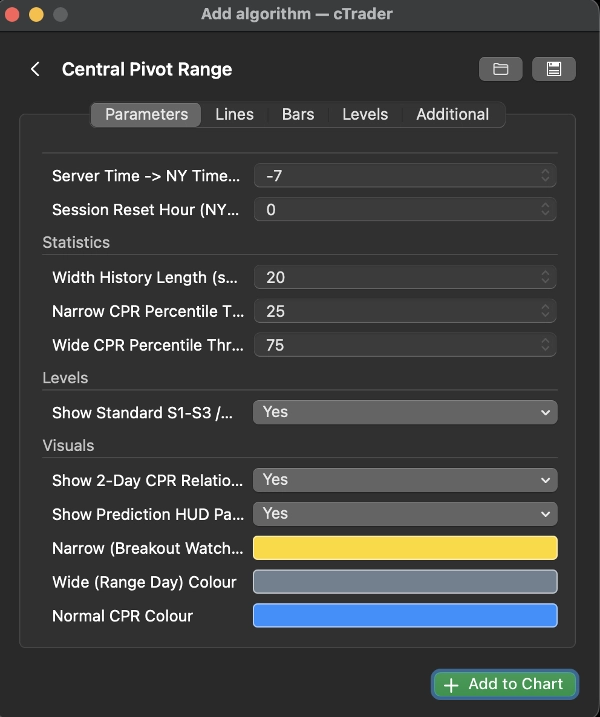
**Key settings:** session reset time (with a server-time-to-NY offset for accurate daily resets), width history length and percentile thresholds for narrow/wide classification, and independent toggles for standard levels and the relationship tag.


**Typical use cases:** predicting whether the session ahead is likely to trend or chop before it opens; using the 2-day relationship to anticipate continuation vs. reversal days; combining CPR width with your own setups as a volatility filter; using CPR position (bullish/bearish/neutral) as a session bias check.


**Best suited for:** intraday and day traders on forex majors, indices, and gold who want an objective, statistically grounded read on the day ahead rather than three flat lines. Less relevant for pure long-term position traders.


Summary

AI summary
Central Pivot Range (CPR) is an intraday trading indicator that extends traditional pivot analysis by predicting the upcoming trading day’s behavior. It calculates today’s Pivot, Top Central Pivot (TC), and Bottom Central Pivot (BC) levels from the previous session’s high, low, and close. Beyond plotting these levels, it provides two key statistical insights:

1. CPR Width Percentile: Ranks the current CPR width against recent history to indicate likely day types—narrow widths suggest potential breakout/trend days, while wide widths indicate range-bound, choppy sessions.

2. 2-Day CPR Relationship: Compares today’s CPR range to yesterday’s, classifying market conditions into categories such as bullish continuation, bearish continuation, trend continuation, choppy, volatile reversal risk, or sideways uncertainty, each with distinct implications.

The indicator visually encodes CPR width with color shading (gold for narrow, grey-blue for wide, blue for normal) and includes standard pivot levels (S1-S3, R1-R3) as optional overlays. A live HUD panel summarizes day type, width percentile, 2-day relationship, and current price position relative to CPR (bullish, bearish, neutral).

Key settings allow customization of session reset timing, width history length, percentile thresholds, and display toggles. This tool is designed for intraday and day traders focusing on forex majors, indices, and gold who seek an objective, statistically grounded forecast of daily market structure and volatility.
Indicator profile
Indicator category
Market structure (SMC)
Output type
Visualisation
Signals
Data requirements
Tick data
Supported signals
Trend strength

Customer reviews

0.0
Reviews: 0
Customer reviews
No reviews for this product yet. Already tried it? Be the first to tell others!

Discussion

FAQ

Key Levels
AI-assisted
Liquidity Sweep
Market Structure
Supply & Demand
ATR
Support & Resistance
Products available through cTrader Store, including trading bots, indicators and plugins, are provided by third-party developers and made available for informational and technical access purposes only. cTrader Store is not a broker and does not provide investment advice, personal recommendations or any guarantee of future performance.

More from this author

Indicator
AI-assisted
Order Block
+5
The daily bias estimator indicator uses ICT concepts to show whether the chart is bullish or bearish on multi-time frame
Indicator
ATR
BOS
+5
Full ICT/SMC 4-step setup checker that alerts a long or short setup.
Indicator
Volume
Fibonacci
+5
Classic 9:30 Opening Range Breakout — auto-plots the range, flags volume-confirmed breakouts long or short, live.
Indicator
Flag
VWAP
+5
Session VWAP with statistical deviation bands, gradient cloud, and live rejection alerts — see exactly how stretched pri
Indicator
MSS
AI-assisted
+5
Live ICT Silver Bullet detection: liquidity sweeps, structure shifts, and killzone-gated FVGs, graded and glowing in rea
Indicator
Triangle
Double Top
+5
Know which liquidity sweeps are real. Auto-tracks EQH/EQL and confirms genuine reversals, not just broken levels.
Indicator
BOS
EMA
+5
Directional volume heatmap: see if a price zone was built on buying or selling, not just how much.
Indicator
ATR
MSS
+5
Grades ICT Unicorn setups (Breaker Block + FVG confluence) into PRIME / SETUP / WATCH, with retest & RR targets.
Indicator
BOS
Volume
+5
20/40/60-day IPDA lookback ranges, Premium/Discount/Equilibrium zones, and quarterly shift alerts — anchored to true dai
Indicator
BOS
MSS
+5
One indicator, full ICT/SMC picture — structure, OBs, FVGs, liquidity, Premium/Discount — with graded PRIME/SETUP signal
Indicator
ATR
Volume
+5
Order blocks with measured hold-rate stats and confidence scoring — not just zones on a chart.
Indicator
BOS
CHOCH
+5
BOS/CHoCH signals confirmed by liquidity sweep + FVG confluence, with a live conviction score.

You may also like

Indicator
Signal
USDJPY
See USD demand in one line—Composite OBV fuses six major FX pairs into a clear momentum gauge.
Indicator
Volume
Key Levels
+2
Support and resistance from a rolling volume profile, ranked by strength or recency, updated live.
Indicator
RSI
EURUSD
+2
It identifies areas of market imbalance (Fair Value Gaps or FVGs) and projects them on the chart in a smart way
Indicator
Forex
Signal
+4
Gann Pivot Vision is an innovative analytical tool that combines classic pivot reversal levels and Gann geometry
Indicator
AI
Prop
+9
A cutting‑edge trading indicator that fuses AI and mathematics with adaptive logic to classify market regimes.
Indicator
AI
Forex
+5
Dynamic, color‑coded candles reveal market shifts instantly—spot momentum and trend reversals at a glance
"ATR Bands" logo
Popular
4.7
(4)
$19
Indicator
ATR
Prop
+13
Enhance trading with ATR Bands! Visualize market volatility using dynamic upper and lower ATR bands for precise decision
Indicator
ATR
RSI
+16
Highlight market consolidation zones instantly with this Inside Candle indicator — precise, clean, and powerful.
Indicator
ATR
RSI
+1
Super Trend Rsi ,ATR + trend change distance + dynamic Alpha, divergence/convergence
Indicator
RSI
RSI on the main chart with 45/55 momentum levels, overbought/oversold levels, averaged RSI, and multi-timeframe support.
Indicator
Volume
Order Block
+4
Advanced Pro Volume Profile: Double Back-to-Back, Institutional Dynamic, Fixed Range & Order Flow
Indicator
ATR
Prop
+14
Optimize exits with Chandelier Exit! Visualize stop-loss points dynamically for improved trading precision and safety.
Indicator
AI
SMC
+5
Coloring trendline/ Colored Trendline / Color Trendline
Indicator
Signal
Trades Opening Range Breakouts Indicator with dynamic stops/targets adapting to market volatility.
Indicator
SMC
Prop
+11
Sessions PRO is a professional session visualization indicator - 4 Fully Customizable Sessions
Indicator
Prop
Forex
NEW - PNLs as % - daily, weekly, monthly, or yearly & Spread, Time To Close, PNL Alerts, custom Bid / Ask lines
Indicator
Volume
Custom range volume profile between two draggable anchors. Auto source timeframe, Total/Up-Down/Delta, POC, Value Area.
Indicator
SMC
Prop
+14
BoS ChoCH Pro,Strict Mode,False Breakout Filter,Average hit rate: 72-78%

Price

Since 07/05/2026
5
Sales
63
Free installs




























