present
Sign up and get $50 off your first purchase
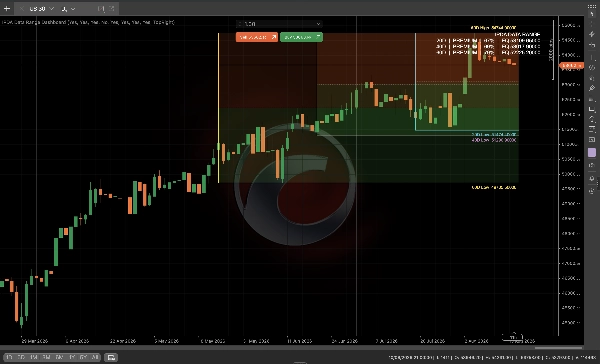
Trading product for IPDA Data Range Dashboard Indicator Breaker Block Premium/Discount , image 1
IPDA Data Range Dashboard
Indicator
Version 1.0, Aug 2026
Windows, Mac
5.0
Reviews: 1
Trading product for IPDA Data Range Dashboard Indicator Breaker Block Premium/Discount , image 2
Trading product for IPDA Data Range Dashboard Indicator Breaker Block Premium/Discount , image 3
Trading product for IPDA Data Range Dashboard Indicator Breaker Block Premium/Discount , image 4
Trading product for IPDA Data Range Dashboard Indicator Breaker Block Premium/Discount , image 5
Since 07/05/2026
5
Sales
63
Free installs

Description

The IPDA data ranges are one of the most foundational concepts in ICT's mentorship β€” and almost every version of this indicator has the same flaw: it counts "days" using whatever timeframe you're currently on, so the ranges are wrong the moment you're not on the Daily chart.

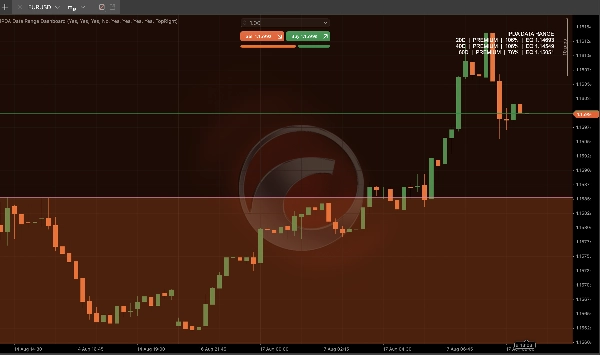
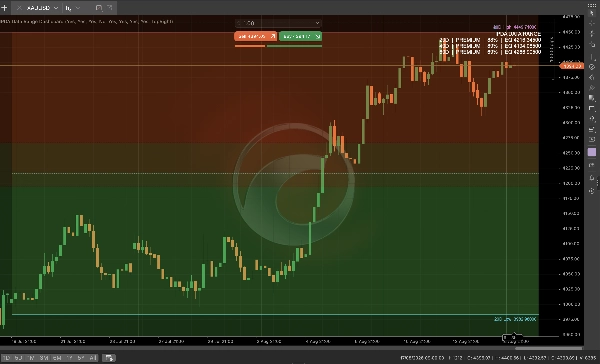
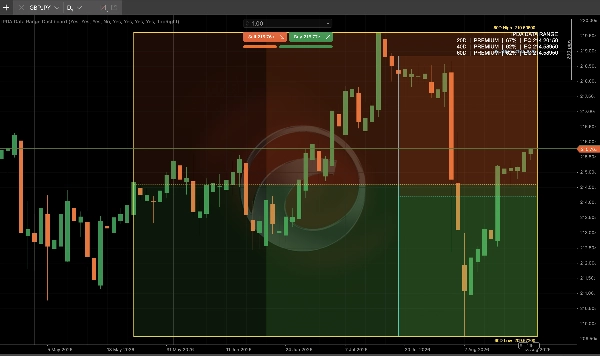
IPDA Data Range Dashboard fixes that. It anchors every range to true daily candles behind the scenes, so your 20/40/60-day institutional lookback zones are accurate whether you're trading the 4H, the 15m, or the Daily itself.

What you get:

  • 20/40/60-day IPDA ranges, each independently toggleable
  • Premium/Discount shading with a live Equilibrium line for every range
  • Quarterly Shift markers β€” flags when price closes beyond the prior 60-day extreme, the real signal of an institutional range expansion
  • Live dashboard panel showing each range's zone, position %, and equilibrium price at a glance
  • Fully accurate on any chart timeframe β€” the core gap in every existing version

Built for traders running higher-timeframe bias models who need premium/discount context without switching to the Daily chart every time. Attach once, trade on whatever timeframe you like.

Summary

AI summary
The IPDA Data Range Dashboard is a trading indicator designed to provide accurate institutional price range analysis anchored to true daily candles. It calculates 20-, 40-, and 60-day IPDA lookback ranges independently of the chart timeframe, ensuring precision whether used on 15-minute, 4-hour, or daily charts. Key features include toggleable IPDA ranges, premium and discount zones with live equilibrium lines, and quarterly shift alerts that flag when price closes beyond prior 60-day extremes, indicating institutional range expansions. The dashboard panel displays each range’s zone, position percentage, and equilibrium price for quick reference. This tool addresses common inaccuracies in other IPDA indicators by maintaining consistent daily anchoring, making it suitable for traders employing higher-timeframe bias models who require premium/discount context without switching chart timeframes. The indicator supports visualization outputs and requires bar data for operation. It integrates concepts related to market structure such as breaker blocks, fair value gaps, breaks of structure, and support/resistance zones.
Indicator profile
Indicator category
Market structure (SMC)
Output type
Visualisation
Signals
Data requirements
Bars only

Customer reviews

5.0
Reviews: 1
5
100 %
4
0 %
3
0 %
2
0 %
1
0 %
Customer reviews
August 19, 2026
A focused and well-executed IPDA analysis tool. The 20/40/60-day ranges, Premium/Discount zones, equilibrium levels and dashboard worked consistently during testing. Most importantly, the same Daily-derived equilibrium values were maintained across M2, H1 and D1 charts, supporting the product's core multi-timeframe claim. The interface can become visually dense with all ranges enabled, but individual toggles make this manageable. Overall, a useful and stable higher-timeframe context tool.

Discussion

FAQ

Breaker Block
Premium/Discount
Fair Value Gap
AI-assisted
BOS
Volume
Support & Resistance
Products available through cTrader Store, including trading bots, indicators and plugins, are provided by third-party developers and made available for informational and technical access purposes only. cTrader Store is not a broker and does not provide investment advice, personal recommendations or any guarantee of future performance.

More from this author

Indicator
AI-assisted
Order Block
+5
The daily bias estimator indicator uses ICT concepts to show whether the chart is bullish or bearish on multi-time frame
Indicator
ATR
BOS
+5
Full ICT/SMC 4-step setup checker that alerts a long or short setup.
Indicator
Volume
Fibonacci
+5
Classic 9:30 Opening Range Breakout β€” auto-plots the range, flags volume-confirmed breakouts long or short, live.
Indicator
Flag
VWAP
+5
Session VWAP with statistical deviation bands, gradient cloud, and live rejection alerts β€” see exactly how stretched pri
Indicator
MSS
AI-assisted
+5
Live ICT Silver Bullet detection: liquidity sweeps, structure shifts, and killzone-gated FVGs, graded and glowing in rea
Indicator
ATR
Key Levels
+5
CPR indicator that actually predicts the day ahead: width percentile scoring for breakout-day detection
Indicator
Triangle
Double Top
+5
Know which liquidity sweeps are real. Auto-tracks EQH/EQL and confirms genuine reversals, not just broken levels.
Indicator
BOS
EMA
+5
Directional volume heatmap: see if a price zone was built on buying or selling, not just how much.
Indicator
ATR
MSS
+5
Grades ICT Unicorn setups (Breaker Block + FVG confluence) into PRIME / SETUP / WATCH, with retest & RR targets.
Indicator
BOS
MSS
+5
One indicator, full ICT/SMC picture β€” structure, OBs, FVGs, liquidity, Premium/Discount β€” with graded PRIME/SETUP signal
Indicator
ATR
Volume
+5
Order blocks with measured hold-rate stats and confidence scoring β€” not just zones on a chart.
Indicator
BOS
CHOCH
+5
BOS/CHoCH signals confirmed by liquidity sweep + FVG confluence, with a live conviction score.

You may also like

Indicator
Forex
BTCUSD
+11
Unlock trading precision with QQE! Dual QQE indicators with a Bollinger Bands zero line provide clear buy/sell signals.
Indicator
AI
Grid
+9
Pivot Point MultiTimeFrame with Order Block
Indicator
Doji
Engulfing
+3
Multi Timeframe OHLC levels (daily, weekly, and monthly), with a two-day price action bias dashboard
Indicator
ATR
RSI
+6
πŸ’Ή Define a price channel πŸ“ˆ and determine trend direction (bullish 🟒 or bearish πŸ”΄).
Indicator
AI
ATR
+26
MacD Custom Indicator-Multiple Time Frame
Indicator
SMC
Forex
+5
ICT liquidity engine for Gold: maps stop clusters, scores zones & projects the next target. Now with 4 ICT killzones.
Indicator
SMC
Prop
+4
πŸ“ˆ Trading Sessions Indicator β€” London, New York & Tokyo Visualize Key Market Sessions + High/Low Levels with Precision
Indicator
Indices
this indicator shows previous day high low and closed with precise manner.
Indicator
SMC
Prop
+13
Institutional FVG detection with HTF projection, precise volume deltas, and smart fill logic.
Indicator
SMC
Prop
+8
KILLZONES AND MACRO SESSIONS
Indicator
RSI
Breakout
+1
"Identify key market zones and visualize support/resistance from multiple timeframes on a single chart.
Indicator
BOS
CHOCH
+5
MyZTrade High TF candle is a multi-timeframe visualisation tool that overlays completed higher-timeframe candles.
Indicator
Key Levels
Support & Resistance
Clean psychological round-number grid with native pip and point auto-scaling across Forex, Gold, Indices, and Crypto.
Indicator
ATR
EMA
+4
SCALPING M1 CTRADER v1.0 β€” Institutional-Grade M1 Gold & Forex Scalping System
Indicator
RSI
XAUUSD
+2
Automatic ZigZag swings with dynamic support & resistance levels, labeling highs/lows for clear trend signals.
Indicator
Volume
Key Levels
+4
Session & Kill Zone Highlighter - Visual tool for London, NY, Tokyo, Sydney sessions plus ICT Kill Zones.
Indicator
Forex
Real-Time Candlestick Pattern Detection with Custom Alerts & Trend Analysis for cTrader
Indicator
Key Levels
Support & Resistance
Draws a colored High/Low/Open/Close box for any custom time range you set β€” trade breakouts & retests.

Price

Since 07/05/2026
5
Sales
63
Free installs