Description
What is a Trendline Indicator?
A trendline indicator is a technical analysis tool used by traders and analysts to identify the direction and strength of a trend in a financial market. It is based on drawing a straight line that connects two or more price points on a chart. The primary purpose of a trendline is to visually represent the general direction of price movement over a specific period.
Multi Timeframe Trendline Indicator
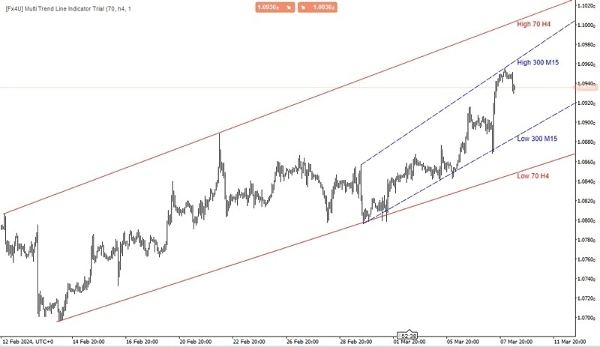
The primary function of a multi-timeframe trendline indicator is to provide traders with a broader perspective of the market trends by aggregating information from various timeframes. By analyzing trends across multiple timeframes, traders can make more informed decisions about potential entry and exit points, as well as the overall direction of the market.
This type of indicator typically allows traders to customize the timeframes they want to analyze and plot trendlines accordingly. It can be a valuable tool for identifying key support and resistance levels, trend reversals, and trend continuations across different timeframes, thereby aiding traders in making more accurate trading decisions.
There are several types of trendlines, including:
- Upward Trendline: This is drawn by connecting two or more successive lows on a price chart. It suggests an upward trend, indicating that prices are generally rising over time.
- Downward Trendline: Conversely, a downward trendline is drawn by connecting two or more successive highs on a price chart. It suggests a downward trend, indicating that prices are generally falling over time.
- Horizontal Trendline: Also known as support or resistance lines, these are drawn horizontally to indicate areas where price movement tends to stall or reverse.
Traders often use trendlines in conjunction with other technical indicators and analysis methods to make informed trading decisions. When a trendline is broken or breached, it may indicate a potential change in the direction of the trend, providing trading signals for investors.
My other products:
https://ctrader.com/products/346
https://ctrader.com/products/336
https://ctrader.com/products/343
https://ctrader.com/products/347
https://ctrader.com/products/148
Summary
This multi-timeframe indicator aggregates trend information across customizable timeframes, providing a comprehensive market overview. It supports the identification of upward, downward, and horizontal trendlines, which correspond to rising trends, falling trends, and support or resistance levels, respectively. By integrating trendlines from various timeframes, traders can better detect trend continuations, reversals, and key support/resistance zones.
The indicator assists in making informed trading decisions by highlighting potential entry and exit points based on trendline breaks or breaches. It is intended for use alongside other technical indicators and analysis methods to enhance market interpretation and trading accuracy.
Customer reviews
5 | 67 % | |
4 | 0 % | |
3 | 33 % | |
2 | 0 % | |
1 | 0 % |
!["[Fx4U] GBPUSD - Price Action" logo](https://cdn.ctrader.com/image/webp/d80b34fc-da3c-4f01-a321-456450665649_26190)

!["[Fx4U] CADJPY - Price Action" logo](https://cdn.ctrader.com/image/webp/1ba81247-b6b7-4f3c-a297-fa3eb1d57fe1_26195)

!["[Fx4U] AUDCHF - Price Action" logo](https://cdn.ctrader.com/image/webp/0a22e9aa-c83b-42cd-b0b8-c1a2da593207_26148)

!["[Fx4U] EURAUD - Price Action" logo](https://cdn.ctrader.com/image/webp/baf8dde4-1ef3-4beb-8ae2-0fed8320f65d_26177)