



Description
Full documentation, every setting and all the data in more detail on our website - realbacktesting.com
Liquidity & Structure (SMC) (Pro) — the complete Smart-Money-Concepts suite for cTrader. No repaint, and it measures itself.
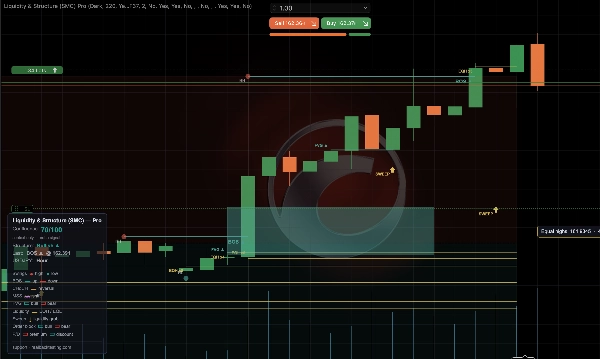
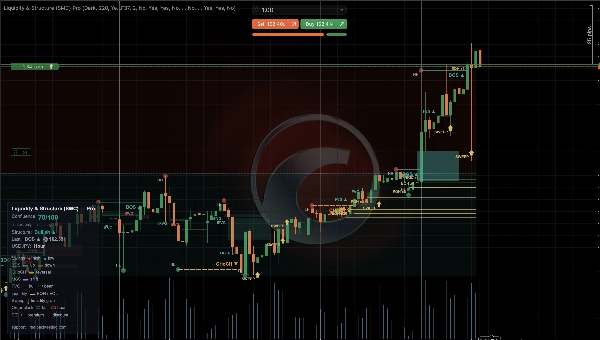
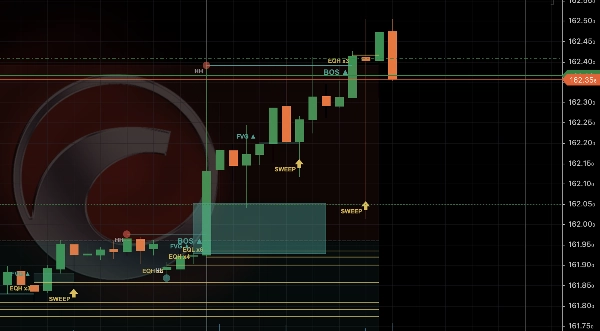
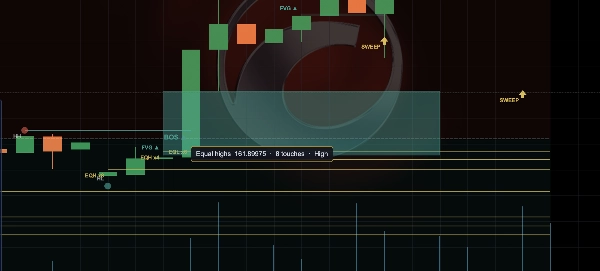
One clean indicator draws the whole SMC picture: market structure (BOS / CHoCH / MSS), fair-value gaps, liquidity pools and sweeps, order blocks, premium/discount — and a 0–100 confluence score so you see at a glance when they line up. Every element has an on-click price tooltip. It never repaints. And it answers the question every other SMC tool leaves hanging: does this actually work on MY chart?
WHAT IT DOES
✅ Market structure — BOS / CHoCH / MSS, auto-labelled
✅ Fair-value gaps — drawn, filled-state tracked, inverse FVG, minimum-size filter
✅ Liquidity — equal highs / lows, stop-hunt sweeps with wick-rejection confirmation
✅ Order blocks — with displacement and body quality filters
✅ Premium / discount — where price sits inside the current swing range
✅ Multi-timeframe structure — read the higher timeframe without leaving the chart
✅ 0–100 confluence score — context, never an entry trigger
✅ On-click price tooltips — the exact level on every element
✅ No-repaint · configurable colours, widths, opacity and layers
✅ Alerts — popup, sound, email and Telegram, per event
MEASURED RELIABILITY — what nothing else in this category does
On your own bars, it counts how often price reacted at each order block, gap and sweep, and prints the rate next to its sample size. Then it goes further:
▸ Broken down by session — three sessions, your own windows, each read in its market's own clock, so the summer shift is applied for you
▸ Auto-calibration — it sweeps 12 displacement/body settings and reports the best for your symbol TOGETHER WITH the median of the sweep. A best far above the median is variance, not an edge, and now you can see the difference
▸ FVG entry compared — the near edge against waiting for the 50%, same stop, both rates shown
▸ Touch delay — the 50th / 75th / 90th percentile of how long a level takes to be hit
▸ A quality filter that stops drawing order blocks below a measured hit rate
These are counts of price reaction on closed candles: no entries, no stops, no costs. Not a strategy result — a number you can reproduce.
WHY IT ADDS VALUE
Most SMC tools draw one or two things and repaint the rest. This is the full stack in a single no-repaint overlay, with 80 parameters that each explain themselves in the panel — and, above all, with the honesty of measuring its own zones instead of asking you to trust them.
PRICING
$29 — one-time, lifetime. No subscription, no rental.
A free edition is available — structure, gaps, order blocks, liquidity, premium/discount and the measurement — so you can try it on your own charts first: ctrader.com/products/4702
HOW TO USE
1. Add to cTrader → chart → Indicators → "Liquidity & Structure (SMC)".
2. Give it a few seconds to load history so the measurement is complete.
3. Read "Best setting here" and apply it to your symbol.
4. Click any element to read its exact price. It maps the chart live and never repaints.
== WHAT COMES NEXT ==
This indicator maps and measures. It does not size, stop or sit out for you — that is the other half, and it is what our portfolio cBots automate, with verified Python/C# parity and results tracked live by cTrader:
👉 Balanced FTMO Swing, free edition, backtest it on your own costs: ctrader.com/products/4615
Summary
It identifies liquidity pools, sweeps, and grabs, highlighting stop-run events, and marks bullish and bearish order blocks. A unique feature is the 0–100 confluence score, which quantifies the alignment of various SMC signals to help users quickly assess the strength of combined market factors. Each structural element, order block, and fair-value gap includes on-click price tooltips for precise level reading.
The indicator is configurable, allowing customization of colors, widths, opacity, and which elements to display. It operates live on charts without repainting, ensuring that displayed signals remain consistent after they appear. This tool consolidates the full SMC suite into one interface, facilitating detailed market structure analysis and liquidity assessment for traders using cTrader.
















!["[Hamster-Coder] Moving Average MTF" logo](https://cdn.ctrader.com/image/webp/b11b98b1-194d-4b8e-b00e-d611826ad159_31226)












