
Description
What is an “Initial Range” indicator?
This indicator is a port of a Pine Script “Opening Range Breakout” tool.
Originally it was called ORB – Opening Range Breakout: you take the price range of the first minutes of a session, then trade the breakout of that range.
In this version we renamed it to IR – Initial Range, but the idea is the same:
- The indicator builds several Initial Ranges:
- IR5 – first 5 minutes
- IR15 – first 15 minutes
- IR30 – first 30 minutes
- IR60 – first 60 minutes
- For each IR you have:
- IR High
- IR Low
- IR Mid (the midpoint of the range)
- You can choose which ranges are active and what colors they use.
Once a range is complete, the indicator looks for price breaking out of it:
- Break above the IR High → IR60 LONG, IR30 LONG, etc.
- Break below the IR Low → IR60 SHORT, IR30 SHORT, etc.
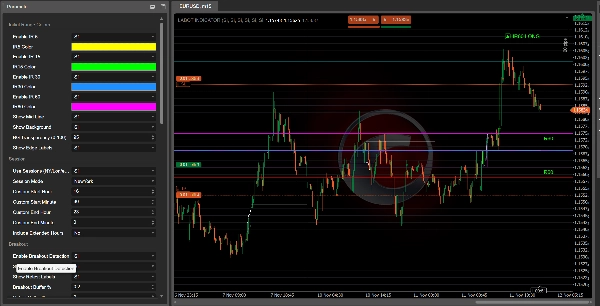
These labels appear on the chart so you can quickly see which initial range produced the signal.
Filters and confirmations
The indicator is designed to avoid random breakouts by combining several filters:
- Trend filter
You can use: - VWAP
- EMA
- Custom EMA length
- VWAP + EMA together
Breakouts in the trend direction are favored (for example, LONG only when price is above VWAP/EMA).
- Volume filter
The indicator compares current volume with a moving average of volume: - “normal” confirmation
- “strong” volume
Breakouts with weak volume can be ignored if you wish.
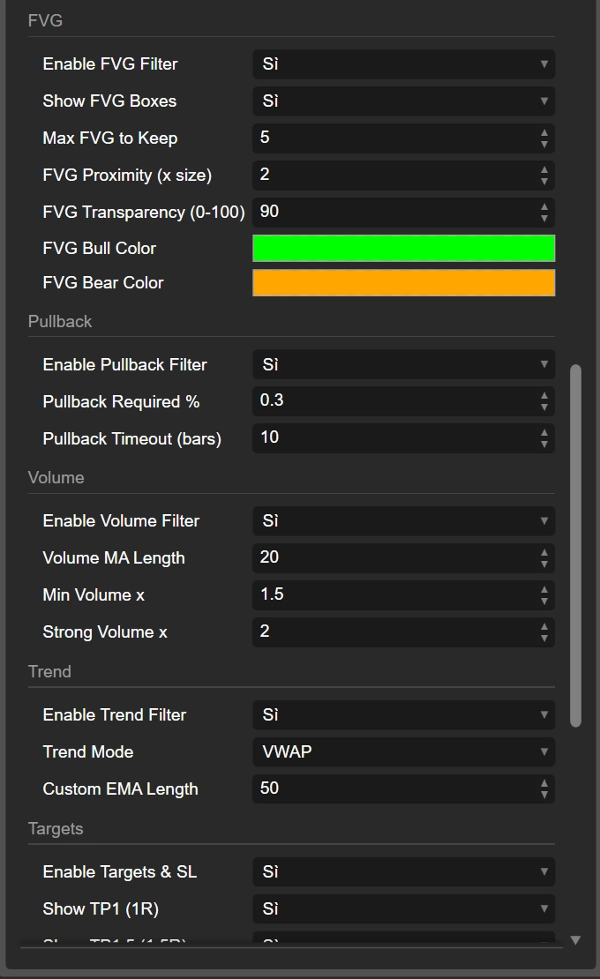
- FVG (Fair Value Gap) filter
It detects bullish and bearish FVGs and can require that the breakout happens near a relevant FVG: - Bullish FVG near IR High supports LONG
- Bearish FVG near IR Low supports SHORT
- Pullback filter
You can require a minimum pullback after the breakout and a time window (in bars) for that pullback to happen. This helps you focus on breakouts that actually “breathe” before continuing.
Breakouts, retests, and failed breaks
After a breakout from the Initial Range, the indicator tracks what price does next:
- It counts how many bars stay outside the range.
- It checks whether price moves far enough away (minimum distance in %).
- It then watches for a retest back into the range.
You can see:
- IR60 LONG / IR60 SHORT (breakout)
- Retest LONG / Retest SHORT labels when price comes back after a solid move
- Failed LONG / Failed SHORT labels when a breakout fails quickly and price re-enters the range without commitment.
This gives you three types of information:
- clean breakout
- healthy breakout with retest
- fake/failed breakout
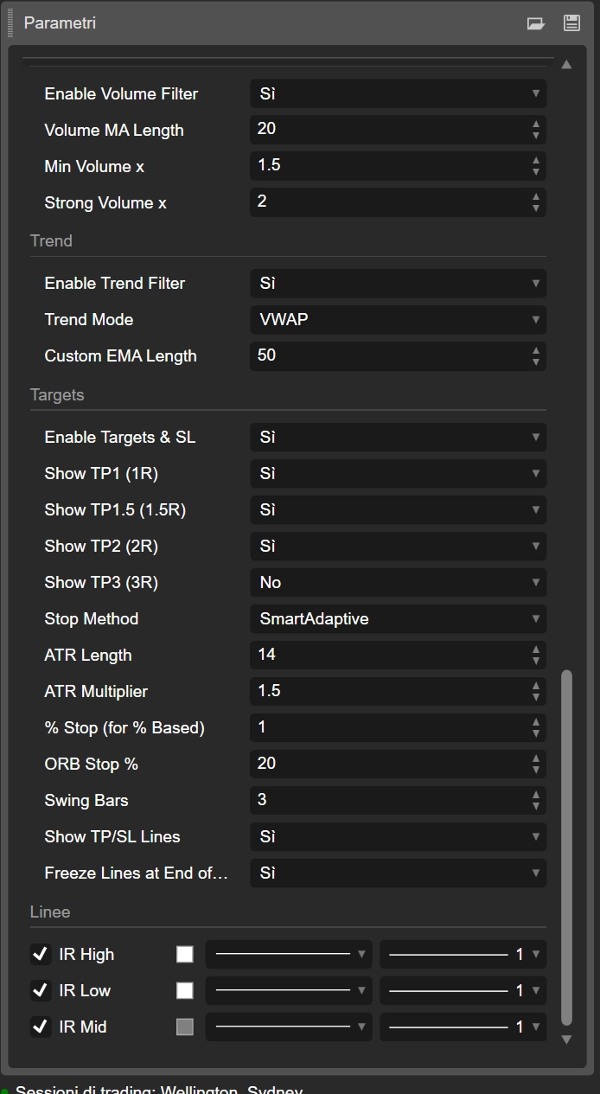
Targets, stop loss and trade visualization
The indicator also calculates automatic TP and SL levels based on:
- ATR
- % of the IR width
- fixed % stops
- swing points
- “smart” adaptive and scaled ATR modes
From the entry price and stop level it computes several targets:
- TP1 (1R)
- TP1.5 (1.5R)
- TP2 (2R)
- TP3 (3R)
You can choose which targets to show.
Lines are drawn on the chart:
- IR_ENTRY_LONG / IR_ENTRY_SHORT
- IR_SL_LONG / IR_SL_SHORT
- IR_TP1 / IR_TP1.5 / IR_TP2 / IR_TP3
When price hits a target or stop, the state is updated and the lines can be “frozen” either after the last TP or at end of day, depending on your settings.
In short
- Old name: ORB (Opening Range Breakout)
- New name: IR (Initial Range) – same concept, cleaner naming
- It builds early-session ranges (IR5, IR15, IR30, IR60)
- It marks LONG / SHORT breakouts, retests, and failed breaks
- It uses trend, volume, FVG, and pullback filters to improve quality
- It draws entry, stop and multiple targets directly on the chart
So when you see “IR60 LONG” on the chart, you’re basically looking at an Opening Range Breakout on the first 60 minutes of the session – just with a more modern, customizable name and a lot of extra logic behind it.
Summary
The indicator marks breakout signals when price moves above the range high (LONG) or below the range low (SHORT), displaying corresponding labels on the chart. It also tracks retests and failed breakouts, distinguishing clean breakouts, healthy retests, and fake moves.
To improve signal quality, the indicator incorporates multiple filters: trend filters using VWAP and EMA, volume filters comparing current volume to averages, Fair Value Gap (FVG) filters detecting bullish or bearish imbalances near breakout levels, and pullback filters requiring minimum retracements after breakouts.
Additionally, it calculates and plots automatic entry, stop loss, and multiple take profit levels based on ATR, percentage of the initial range width, fixed percentages, swing points, and adaptive ATR modes. These visual aids help traders manage risk and targets directly on the chart.
The Initial Range indicator supports various markets including Forex, stocks, indices, commodities, and cryptocurrencies, and is designed to enhance breakout trading strategies with customizable parameters and comprehensive trade visualization.
Customer reviews
5 | 100 % | |
4 | 0 % | |
3 | 0 % | |
2 | 0 % | |
1 | 0 % |


