
Breakout channel
Indicator
521 downloads
Version 1.0, Nov 2025
Windows, Mac
Description
Breakout Channels
What it does
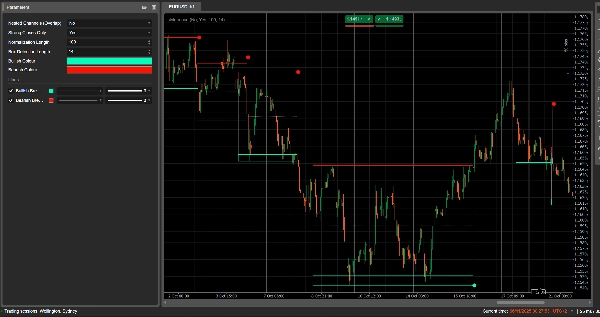
Breakout Channels automatically detects consolidation ranges (price “boxes”) and marks breakout points when price escapes those ranges.
It draws:
- A grey channel box around the consolidation zone
- A red upper band (potential resistance)
- A green lower band (potential support)
- A white dotted midline (channel midpoint)
- Coloured dots when a breakout occurs:
- Green/cyan dot below the box → bullish breakout
- Red dot above the box → bearish breakout
The idea is to visually highlight areas where price is coiling and where strong moves are likely to start when the range breaks.
How it calculates
- Price normalisation
- Over the last Normalization Length bars it finds the highest high and lowest low.
- It normalises the close into a 0–1 range:
normalizedPrice=Close−LowestLowHighestHigh−LowestLow\text{normalizedPrice} = \frac{\text{Close} - \text{LowestLow}}{\text{HighestHigh} - \text{LowestLow}}normalizedPrice=HighestHigh−LowestLowClose−LowestLow
- Volatility measure
- It computes the standard deviation of the normalised price over 14 bars.
- This gives a volatility series used to detect turning points in the market structure.
- Upper / Lower “volatility lines”
- Over the last (Box Detection Length + 1) bars, it finds:
- the bar where volatility was highest
- the bar where volatility was lowest
- From how many bars ago these extremes occurred, it builds two synthetic lines: Upper and Lower.
- Crosses between these lines signal potential start/end of a channel phase.
- Channel start & duration
- When Lower crosses above Upper, the indicator marks a potential channel start.
- From that bar it tracks the duration and the highest high / lowest low in the period.
- Channel creation
- When later Upper crosses back above Lower, and the duration is greater than 10 bars:
- It defines the channel Top as the highest high in that period.
- It defines the channel Bottom as the lowest low.
- It measures the current ATR/2 to separate a thin zone at the top and bottom:
- Red band at the top (bearish band)
- Green band at the bottom (bullish band)
- It draws:
- Grey outline rectangle (full channel)
- Red top outline
- Green bottom outline
- A dotted white midline through the centre
- Channels remain on the chart as historical structure (they are not deleted after breakout).
- Breakout detection
- For each active channel, on every new bar it calculates a reference price:
- If Strong Closes Only = true → uses the midpoint of the candle body:
refPrice=(Open+Close)/2\text{refPrice} = (\text{Open} + \text{Close})/2refPrice=(Open+Close)/2
This requires more than half of the body to be outside the box. - If Strong Closes Only = false → uses simple Close.
- If Strong Closes Only = true → uses the midpoint of the candle body:
- Breakout rules:
- If
refPrice > Top→ bullish breakout - Plots a green dot at the channel Bottom.
- Deactivates this channel (stops extending it), but the box stays visible.
- If
refPrice < Bottom→ bearish breakout - Plots a red dot at the channel Top.
- Deactivates the channel.
- Otherwise, the channel is still active and its right edge is extended to the current bar.
- If
- Nested Channels option
- If Nested Channels = true, multiple channels can overlap in time and price.
- If false, the indicator blocks creation of a new channel that would overlap an existing one.
How to read and use it
- Grey box (channel)
- Represents a consolidation / balance zone where price has been trading for a while.
- The longer and taller the box, the more significant the range.
- Red upper band (resistance zone)
- The top portion of the channel, visually emphasised as a potential resistance area.
- Repeated rejections near this band suggest selling pressure inside the range.
- Green lower band (support zone)
- The bottom portion of the channel, highlighted as potential support.
- Repeated bounces suggest buyers defending the lower edge of the range.
- White dotted midline
- The midpoint of the channel – a kind of local “fair value”.
- Price oscillating around this line indicates balance; strong moves away often precede a test of the opposite band.
- Breakout dots
- Green dot below the box:
- Price has closed strongly above the top of the channel (or simply closed above, depending on Strong Closes Only).
- Suggests a bullish breakout – potential start of an up-move from a volatility squeeze.
- Red dot above the box:
- Price has closed strongly below the bottom of the channel.
- Suggests a bearish breakout – potential start of a down-move.
- Typical ways to use it (idea-level)
- Trend-following breakouts
- Trade in the direction of the breakout (buy after green dot, sell after red dot), ideally in confluence with higher-timeframe trend or other indicators.
- Filter & confirmation
- Use the channel and its breakout only as a filter for your existing strategy (e.g. only take long setups if the last signal was a bullish breakout).
- Risk placement
- For bullish breakouts, many traders place stops inside or just below the former channel; for bearish, inside or above the box.
Summary
AI summary
Breakout Channels is a technical indicator designed to identify consolidation zones and signal potential price breakouts. It automatically detects price ranges where the market is coiling, marking these with a grey channel box that highlights the consolidation area. The indicator draws a red upper band indicating potential resistance, a green lower band indicating potential support, and a white dotted midline representing the channel midpoint or local fair value.
Breakout points are signaled by colored dots: a green or cyan dot below the box indicates a bullish breakout, while a red dot above signals a bearish breakout. The indicator calculates these zones by normalizing price data, measuring volatility through the standard deviation of normalized prices, and identifying volatility extremes to define channel start and duration.
Channels remain visible on the chart as historical structures even after breakouts. Users can enable nested channels to allow overlapping consolidation zones. Breakout detection uses either candle body midpoints or close prices, depending on settings, to confirm strong closes outside the channel.
Typical uses include trading in the breakout direction, filtering existing strategies, and placing risk stops near channel boundaries. The indicator supports various markets including forex, indices, commodities, stocks, and cryptocurrencies.
Indicator profile
Customer reviews
0.0
Reviews: 0
Customer reviews
No reviews for this product yet. Already tried it? Be the first to tell others!
Discussion
FAQ
Signal
Indices
Commodities
GBPUSD
RSI
Bollinger
Fibonacci
Scalping
AI
XAUUSD
NAS100
MACD
BTCUSD
Forex
Breakout
EURUSD
NZDUSD
Martingale
Prop
ZigZag
Supertrend
Fair Value Gap
SMC
Crypto
Grid
Stocks
ATR
USDJPY
VWAP
Products available through cTrader Store, including trading bots, indicators and plugins, are provided by third-party developers and made available for informational and technical access purposes only. cTrader Store is not a broker and does not provide investment advice, personal recommendations or any guarantee of future performance.


Price
42.11M
Traded volume
6.13M
Pips won
222
Sales
8.39K
Free installs