
Liquidity Shift Indicator
Indicatore
699 download
Versione 1.0, Dec 2025
Windows, Mac
5.0
Recensioni: 1

Descrizione
Indicatore di Spostamento della Liquidità – Strumento di Struttura di Mercato e Liquidità
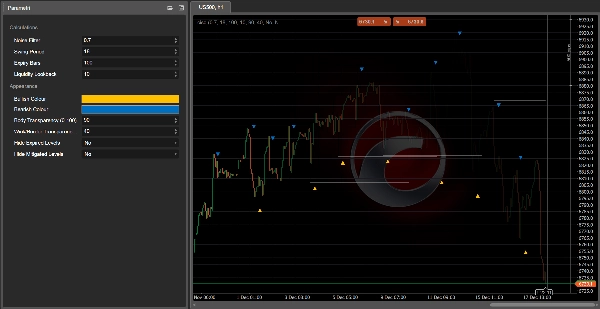
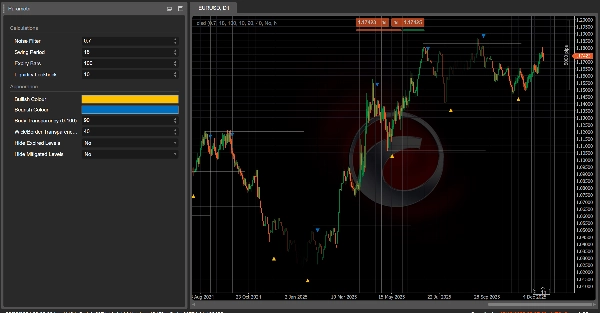
L'Indicatore di Spostamento della Liquidità identifica livelli di liquidità swing-high / swing-low e rileva eventi CISD (Change in State of Delivery), che spesso segnalano un cambiamento nell'intento di mercato dopo che il prezzo interagisce con la liquidità.
Caratteristiche Principali
- Traccia automaticamente livelli di liquidità basati su swing high e swing low.
- Monitora quando i livelli di liquidità sono mitigati (spazzolati/toccati) e può opzionalmente nasconderli per un grafico più pulito.
- Rileva condizioni CISD rialziste e ribassiste utilizzando cambiamenti di stato delle candele e un Filtro Rumore configurabile per ridurre i falsi segnali.
- Evidenzia segnali CISD forti quando un CISD si verifica poco dopo una spazzolata di liquidità opposta (basata sull'impostazione Liquidity Lookback).
- Aiuta i trader a individuare spazzolate di liquidità, cambiamenti di struttura, potenziali inversioni e configurazioni di continuazione.
Input Personalizzabili
- Filtro Rumore (controlla la sensibilità e riduce il rumore)
- Periodo Swing (definisce come vengono rilevati i punti swing)
- Barre di Scadenza (per quanto tempo i livelli di liquidità rimangono attivi)
- Liquidity Lookback (quanto recente deve essere una spazzolata per qualificarsi come segnale “forte”)
- Opzioni per nascondere i livelli scaduti e/o mitigati
Nota
L'Indicatore di Spostamento della Liquidità è progettato per l'analisi e la conferma. Combinalo sempre con una corretta gestione del rischio e un contesto di mercato aggiuntivo (trend, volatilità, livelli di timeframe superiore).
Vuoi un cBot basato su questo indicatore? Contattaci!
Riepilogo
Riepilogo AI
The Liquidity Shift Indicator is a market structure and liquidity analysis tool designed to identify swing-high and swing-low liquidity levels. It detects Change in State of Delivery (CISD) events, which often indicate shifts in market intent following price interactions with liquidity. The indicator automatically plots liquidity levels based on swing points and tracks when these levels are mitigated (swept or touched), with options to hide mitigated or expired levels for clearer charts.
Key functionalities include detection of bullish and bearish CISD conditions using candle state changes combined with a configurable Noise Filter to minimize false signals. It highlights strong CISD signals that occur shortly after opposing liquidity sweeps, aiding traders in spotting liquidity sweeps, structural shifts, potential reversals, and continuation setups.
Customizable inputs allow adjustment of Noise Filter sensitivity, Swing Period for swing point detection, Expiry Bars defining liquidity level duration, and Liquidity Lookback to qualify strong signals. The indicator is intended for analysis and confirmation and should be used alongside proper risk management and additional market context such as trend, volatility, and higher-timeframe levels. It supports various markets including Forex, indices, commodities, stocks, and cryptocurrencies.
Profilo indicatore
Recensioni dei clienti
5.0
Recensioni: 1
5 | 100 % | |
4 | 0 % | |
3 | 0 % | |
2 | 0 % | |
1 | 0 % |
Recensioni dei clienti
December 22, 2025
Liquidity Shift Indicator highlights moments when market balance changes after liquidity runs. Great for SMC traders looking for early trend shifts and impulse confirmation. Clean, stable and best used with structure and FVG context.
Discussioni
Domande frequenti
Signal
Indices
Commodities
GBPUSD
RSI
Bollinger
Fibonacci
Scalping
AI
XAUUSD
NAS100
MACD
BTCUSD
Forex
Breakout
EURUSD
NZDUSD
Martingale
Prop
ZigZag
Supertrend
Fair Value Gap
SMC
Crypto
Grid
Stocks
ATR
USDJPY
VWAP
I prodotti disponibili tramite cTrader Store, inclusi bot di trading, indicatori e plugin, sono forniti da sviluppatori terzi e resi disponibili esclusivamente a scopo informativo e di accesso tecnico. cTrader Store non è un broker e non fornisce consulenze in materia di investimento, raccomandazioni individualizzate o garanzie di risultati futuri.


![Logo di "[Hamster-Coder] Pivot Points (Demo)"](https://cdn.ctrader.com/image/webp/87b54299-8c73-4942-9207-4bc6db824811_31153)


Prezzo
42.11M
Volume negoziato
6.13M
Profitto in pip
231
Vendite
8.57K
Installazioni gratuite