
Açıklama
En kapsamlı mum çubuğu paketi, bugün var olan çoğu mum çubuğu modelini tespit etmenize yardımcı olmak için burada.
Teknik ticaret araçları olan mum çubuğu modelleri, fiyat yönünü tahmin etmek için yüzyıllardır kullanılmaktadır. Fiyat yönünü ve momentumu belirlemek için kullanılan çeşitli mum çubuğu modelleri vardır; bunlar arasında üç çizgi darbesi, iki kırmızı boşluk, üç kırmızı karga, akşam yıldızı ve terk edilmiş bebek bulunur.
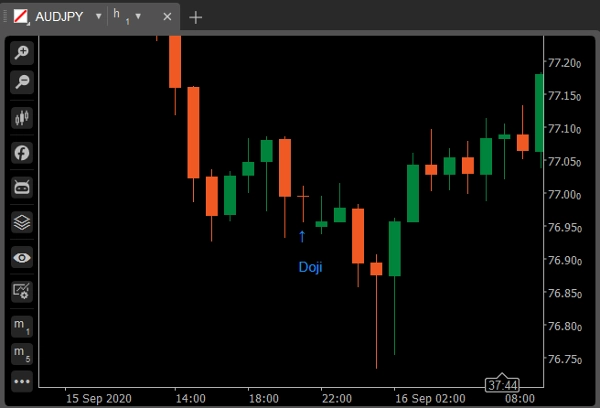
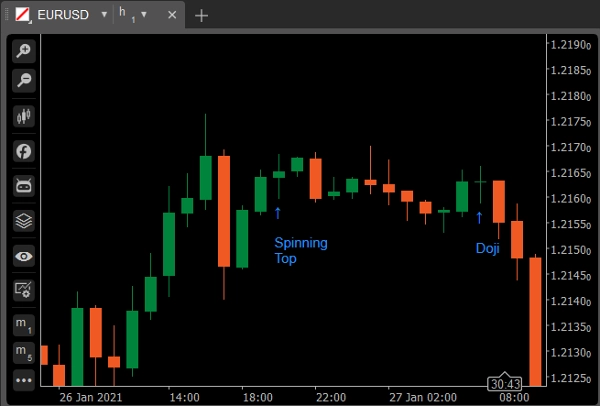
Doji
Doji mum çubuğu, bir varlığın açılış ve kapanış fiyatlarının belirli zaman dilimi için neredeyse eşit olduğu zaman oluşur ve genellikle teknik analistler için bir dönüşüm modeli sinyali verir. Gövde eşiği toplam uzunluğun maksimum %5'idir.
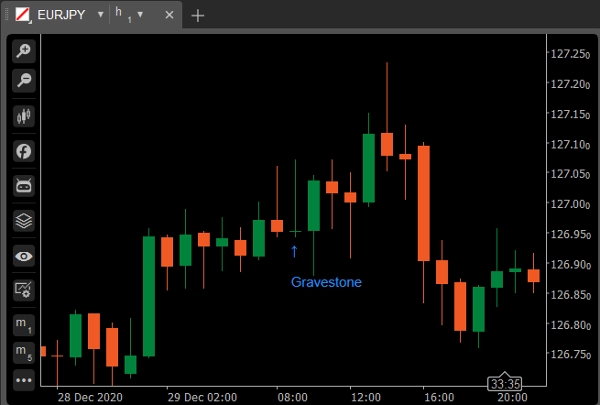
Varyasyon: Mezar Taşı Doji
Varlığın en yüksek, açılış ve kapanış fiyatlarının (neredeyse) aynı olduğu durumlarda oluşur. Uzun alt gölge, mumun süresi boyunca agresif satış olduğunu gösterir, ancak fiyat açılışa yakın kapandığı için alıcıların satışı emip fiyatı tekrar yukarı itebildiğini gösterir.
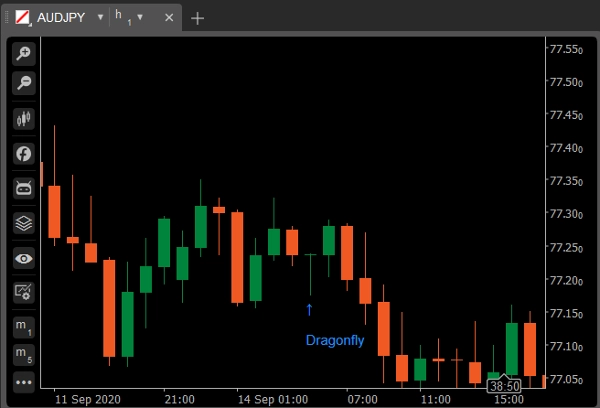
Varyasyon: Yusufçuk Doji
Mezar taşı doji, düşük, açılış ve kapanış fiyatlarının (neredeyse) aynı olduğu ve mumun uzun bir üst gölgesi olduğu durumdur. Mezar taşı ters çevrilmiş bir "T" gibidir. Mezar taşı için çıkarımlar, yusufçuk ile aynıdır. Her ikisi de olası trend dönüşlerini gösterir ancak takip eden mum tarafından doğrulanmalıdır.
Dönen Üst
Dönen üst, uzun üst ve alt gölgeler arasında dikey olarak ortalanmış kısa gerçek gövdesi olan bir mum çubuğu modelidir. Mum çubuğu modeli, varlığın gelecekteki yönü hakkında kararsızlığı temsil eder. Ne alıcılar ne de satıcılar üstünlük sağlayabilmiştir. Gövde eşiği toplam uzunluğun maksimum %20'sidir.
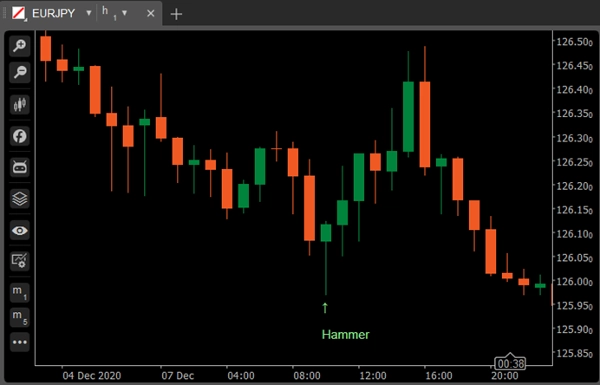
Çekiç
Çekiç, üst gölgesi az veya hiç olmayan ve uzun alt kuyruğa sahip, yüksek yakınında küçük bir gövdeden oluşan yeşil veya kırmızı bir mum çubuğudur. Düşüş trendinde yükseliş modeli olarak kabul edilir.
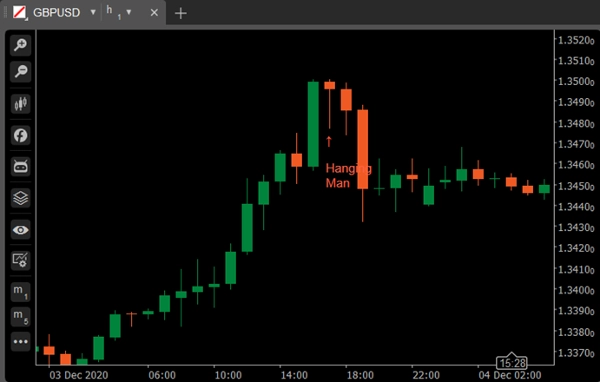
Varyasyon: Asılı Adam
Üst gölgesi az veya hiç olmayan ve uzun alt kuyruğa sahip, yüksek yakınında küçük bir gövdeden oluşan yeşil veya kırmızı bir mum çubuğudur. Yükseliş trendinde düşüş modeli olarak kabul edilir.
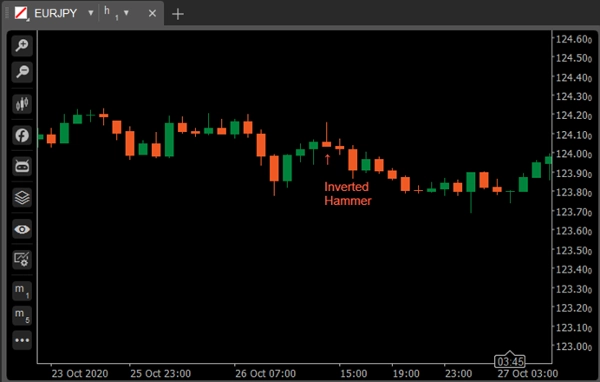
Ters Çekiç
Ters çekiç, bir düşüş trendinden sonra bulunan ve genellikle trend dönüş sinyali olarak kabul edilen bir mum çubuğu modelidir.
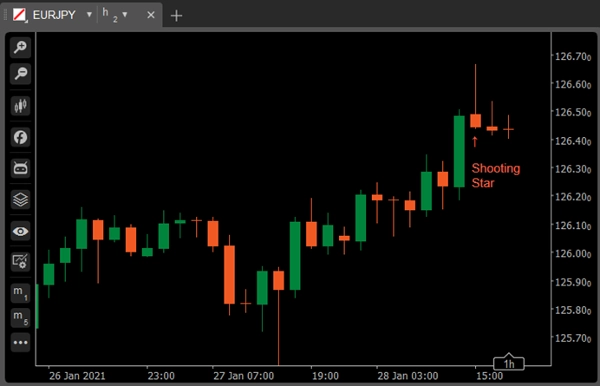
Varyasyon: Yıldız Atıcı
Yıldız Atıcı, Ters Çekiç ile tamamen aynıdır, ancak düşüş trendinde değil yükseliş trendinde bulunur ve bu nedenle farklı anlamlara sahiptir.
Marubozu
Gölgesi veya kuyruğu olmayan uzun veya normal bir mum çubuğu (kırmızı veya yeşil). En yüksek ve en düşük fiyatlar açılış ve kapanış fiyatlarını temsil eder. Devam modeli olarak kabul edilir.
Varyasyon: Marubozu Açılış
Marubozu açılış için açılış fiyatı düz olmalıdır: yani fiyat hareketi sadece tek yönde ilerlemelidir, ancak Marubozu tam mumun aksine, kapanış fiyatı diğer tarafta yüksek/düşükten biraz farklı olabilir. Başka bir deyişle, açılış düz olmalı, diğer tarafta kısa bir fitil için alan olmalıdır.
Varyasyon: Marubozu Kapanış
Marubozu kapanış mumu, Marubozu açılışın tersidir: kapanış düz olmalı, fiyat hareketi diğer yönde biraz hareket edebilir ancak ardından agresif şekilde tek yönde işlem görmeye başlar.
Boğa Yutan
Takip eden büyük yeşil mum çubuğu içinde yer alan daha küçük kırmızı gövdeden oluşur. Alt seviyede göründüğünde önemli bir dönüş sinyali olarak yorumlanır.
Ayı Yutan
Takip eden büyük kırmızı mum çubuğu içinde yer alan daha küçük yeşil gövdeden oluşur. Üst seviyede göründüğünde önemli bir dönüş sinyali olarak kabul edilir.
Delici Çizgi
Delici Çizgi, kırmızı bir mum çubuğunu takip eden, öncekinin en düşük seviyesinden daha düşük açılan ancak kırmızı gövdenin yarısından fazlasına kapanan yeşil bir mum çubuğundan oluşur. Alt seviyede göründüğünde dönüş sinyali olarak kabul edilir.
Karanlık Gölge Örtüsü
Uzun yeşil bir mum çubuğunu takip eden, yeşil mumun yüksek seviyesinin üzerinde açılan ve yeşil mumun gövdesinin içine iyi kapanan kırmızı bir mum çubuğundan oluşur. Yükseliş trendinde ayı dönüş sinyali olarak kabul edilir.
Boğa Harami
Alışılmadık derecede büyük kırmızı bir gövdeyi takip eden, içinde yer alan küçük yeşil gövdeden oluşur. Düşüş trendinden sonra yükseliş modeli olarak kabul edilir.
Varyasyon: Boğa Harami Çarpısı
Büyük kırmızı bir gövdeyi takip eden Doji. Alt seviyede göründüğünde dönüş sinyali olarak kabul edilir.
Ayı Harami
Alışılmadık derecede büyük yeşil bir gövdeyi takip eden, içinde yer alan küçük kırmızı gövdeden oluşur. Yükseliş trendinden sonra ayı modeli olarak kabul edilir.
Varyasyon: Ayı Harami Çarpısı
Büyük yeşil bir gövdeyi takip eden Doji. Üst seviyede göründüğünde dönüş sinyali olarak kabul edilir.
Boğa/Ayı Kicker
Boğa Kicker sinyali genellikle piyasa saatleri öncesi veya sonrası açıklanan büyük bir haber sürprizinden sonra ortaya çıkar. Dramatik bir olay olmuş, yatırımcı duyarlılığında büyük bir değişiklik yaratmış ve kaçınılmaz olarak bir dönüş takip edecektir. İki mum arasındaki boşluk ne kadar büyükse, sinyal o kadar önemlidir.
Sabah/Akşam Yıldızı
Büyük yeşil gövdeli bir mum çubuğunu takip eden, öncekinin üzerinde boşluk bırakan küçük gövdeli (kırmızı veya yeşil) bir mum çubuğundan oluşur. Üçüncüsü, büyük yeşil gövdenin içinde iyi kapanan kırmızı gövdeli bir mumdur. Üst seviyede göründüğünde dönüş sinyali olarak kabul edilir.
Varyasyon: Terk Edilmiş Bebek
Üç Yeşil Asker/Üç Kırmızı Karga
Ardışık olarak daha yüksek kapanışlara sahip üç uzun yeşil mum çubuğundan oluşur. Kapanış fiyatları yükseklerine yakın veya onlardadır. Alt seviyede göründüğünde dip dönüş sinyali olarak yorumlanır.
Ardışık olarak daha düşük kapanışlara sahip üç uzun kırmızı mum çubuğundan oluşur. Kapanış fiyatları düşüklerine yakın veya onlardadır. Üst seviyede göründüğünde tepe dönüş sinyali olarak kabul edilir.
Üç Çizgi Darbesi
Üç çizgi darbesi, trend yönünde üç mum çubuğundan oluşan ve ardından başlangıç noktasına geri çekilen son bir mumun bulunduğu devam eden bir mum çubuğu grubudur. Tüccarlar, üç çizgi darbesini, yakın trend diplerinde satın almak veya yakın zirvelerde satmak için bir fırsat olarak kullanır.
İki Kırmızı Boşluk
Ayı yönlü iki kırmızı boşluk devam modeli, yükseliş trendinde belirgin bir zirveden sonra ortaya çıkar; aşağıya doğru bir boşlukla iki kırmızı çubuk daha düşük dipler yapar. Bu model, düşüşün daha da düşük diplerle devam edeceğini öngörür.
Özet
Müşteri değerlendirmeleri
5 | 100 % | |
4 | 0 % | |
3 | 0 % | |
2 | 0 % | |
1 | 0 % |


!["[Stellar Strategies] Inside Bar with Signals" logosu](https://cdn.ctrader.com/image/webp/1d9e8bfa-3b2c-4440-bb37-5856902008a7_30683)


