
Açıklama
Piyasa bu yeni yönde hareket etmeye devam ederse, bir noktada karşı yönlü işlemin karı, ilk işlemin zararını geçecek ve bu noktada her iki işlemi kapatabilirsiniz.
Piyasa önceki yöne dönerse, daha büyük lot büyüklüğüne sahip karşıt işlem, ilk işlemin kazandığından daha hızlı zarar biriktirecektir. Bu durumda, ilk işlem ve üçüncü işlemin birlikte ikinci işlemden daha büyük olacağı ilk yönde başka bir işlem açarız.
Bu ileri geri hedge stratejisi, fiyat hareketi herhangi bir yönde kırılana kadar devam ettirilebilir.
Zone Recovery Göstergesinin Kullanımı
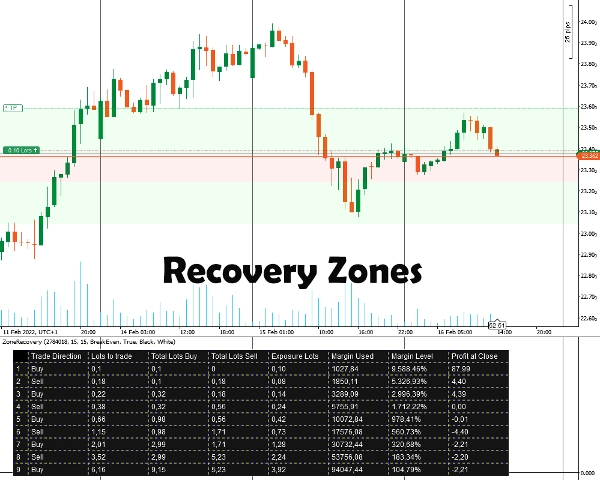
Öncelikle hedge yapmak istediğiniz Pozisyon ID'sini girmeniz gerekir. Pozisyon mutlaka bir kar hedefi olmalıdır. Bundan sonra, hedge yapmaya başlamanız gerektiğine inandığınız pip sayısını girerek Zone Recovery boyutunu seçersiniz. Gösterge, stratejinin çalışması için bölgeleri ve tabloyu gösterecektir.
Tüm sonraki pozisyonlar için emirleri, stop loss ve kar alma hedeflerini manuel olarak yerleştirmeniz gerekecektir.
Önemli Bilgiler
Her şeyden önce, işlem hesabınızın hedge tipi bir hesap olması gerekir.
- Temelde, bu riskleri olan bir martingale stratejisidir. İlk işlem dalgalı bir piyasada açılırsa, bu hızla marjınızı tüketebilir. Daha iyi sonuçlar için volatil/trend olan enstrümanlara ihtiyacınız vardır.
- Düşük komisyonlar/küçük spreadlere sahip işlem enstrümanları daha iyi çalışacaktır.
- İlk işlem minimum lot büyüklüğü ile yapılırsa, sonraki hesaplamalar yanlış komisyon hesaplamaları ve gelecekteki işlemler için yukarı/aşağı yuvarlanmış lot büyüklükleri nedeniyle marjinal olarak yanlış olacaktır.
- Hesabınızın para biriminden farklı bir enstrümanla işlem yaparsanız, marj hesaplaması döviz kurlarının sürekli değişmesi nedeniyle biraz yanlış olacaktır. (Örneğin, EUR hesabı, GBP/USD pozisyonu açmak)
- Swaplar dikkate alınmamaktadır.
Gösterge Seçenekleri
Gösterge aşağıdaki seçenekleri sunar:
- Pozisyon ID - Hedge tablosunu hesaplamak istediğiniz açık pozisyon ID'si. Başlangıçtaki “PID” olmadan (sadece sayılar) girilebilir.
- Zone Recovery Pips - Zone recovery hesaplamaları için dikkate alınacak pip sayısı. Zone recovery sonunda, ilk işleme karşı yönlü işlemler açılmalıdır.
- Hesaplama Modu
İki mod mevcuttur: BreakEven ve Kar
BreakEven: Hesaplamalar, tüm işlemler kapandığında sıfır veya minimum zarar olacak şekilde lot büyüklükleri vermeye çalışır. Daha yavaş marj tüketimi.
Kar: Hesaplamalar, ilk açık işlemin kar hedefini sağlamak için lot büyüklükleri vermeye çalışır. Daha hızlı marj tüketimi. - Zone Recovery Alanlarını Çiz - Zone Recovery alanlarının Grafikte çizilmesini istiyorsanız evet seçin.
- Tablo Rengi / Yazı Rengi - Hedge tablosu için renk seçenekleri.
Özet
Müşteri değerlendirmeleri
5 | 100 % | |
4 | 0 % | |
3 | 0 % | |
2 | 0 % | |
1 | 0 % |


!["[Stellar Strategies] Inside Bar with Signals" logosu](https://cdn.ctrader.com/image/webp/1d9e8bfa-3b2c-4440-bb37-5856902008a7_30683)


