
Описание
Полный набор свечных моделей поможет вам обнаружить большинство существующих сегодня свечных паттернов.
Свечные паттерны, являющиеся техническими торговыми инструментами, используются веками для прогнозирования направления цены. Существует множество свечных паттернов, используемых для определения направления и импульса цены, включая three line strike, two red gapping, three red crows, evening star и abandoned baby.
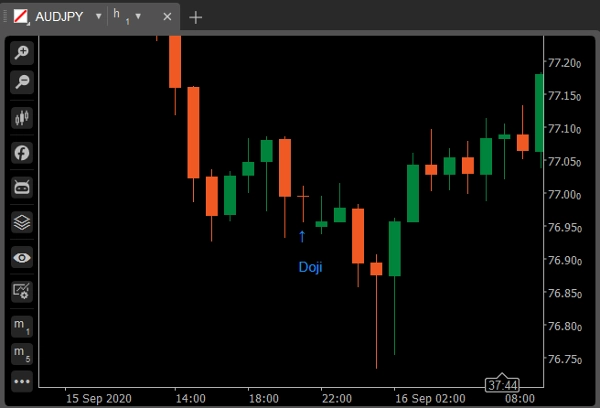
Доджи
Свеча доджи формируется, когда цена открытия и закрытия актива практически равны за данный период времени и обычно сигнализирует о развороте для технических аналитиков. Порог тела свечи составляет максимум 5% от общей длины.
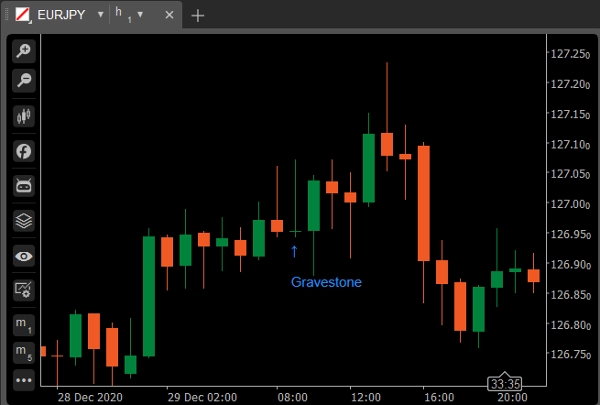
Вариация: Gravestone Doji
Формируется, когда максимальная, открытие и закрытие цены актива (почти) совпадают. Длинная нижняя тень указывает на агрессивные продажи в течение периода свечи, но поскольку цена закрылась близко к открытию, это показывает, что покупатели смогли поглотить продажи и поднять цену обратно вверх.
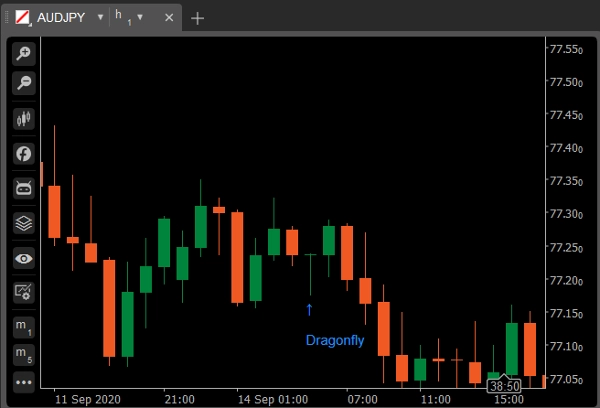
Вариация: Dragonfly Doji
Gravestone doji возникает, когда минимальная, открытие и закрытие цены (почти) совпадают, а свеча имеет длинную верхнюю тень. Gravestone выглядит как перевернутая буква "Т". Значение gravestone такое же, как и у dragonfly. Оба указывают на возможные развороты тренда, но должны быть подтверждены следующей свечой.
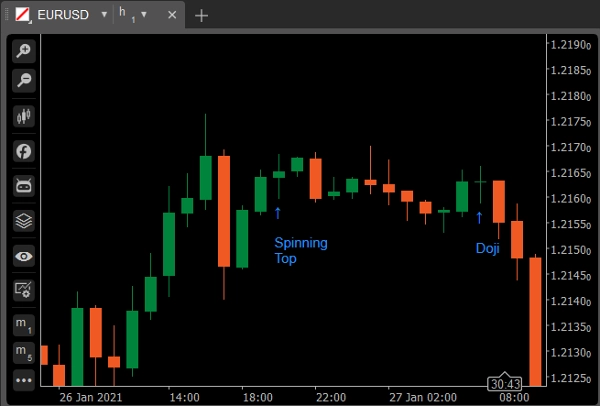
Spinning Top
Spinning top — это свечной паттерн с коротким реальным телом, расположенным вертикально посередине между длинными верхними и нижними тенями. Этот паттерн отражает неопределенность относительно будущего направления актива. Ни покупатели, ни продавцы не смогли взять верх. Порог тела составляет максимум 20% от общей длины.
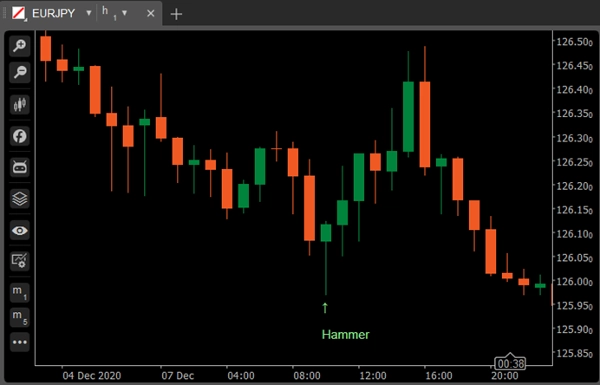
Молот
Молот — зеленая или красная свеча с небольшим телом возле максимума, с небольшой или отсутствующей верхней тенью и длинным нижним хвостом. Считается бычьим паттерном во время нисходящего тренда.
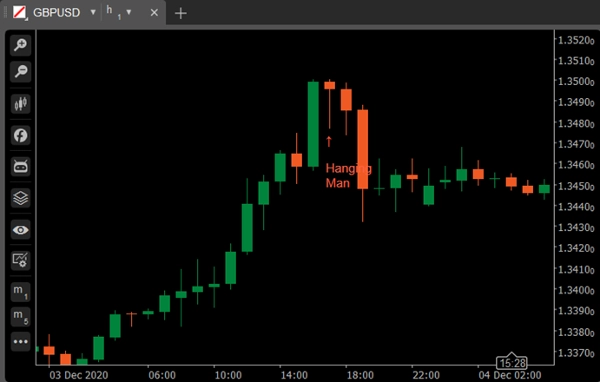
Вариация: Hanging Man
Зеленая или красная свеча с небольшим телом возле максимума, с небольшой или отсутствующей верхней тенью и длинным нижним хвостом. Считается медвежьим паттерном во время восходящего тренда.
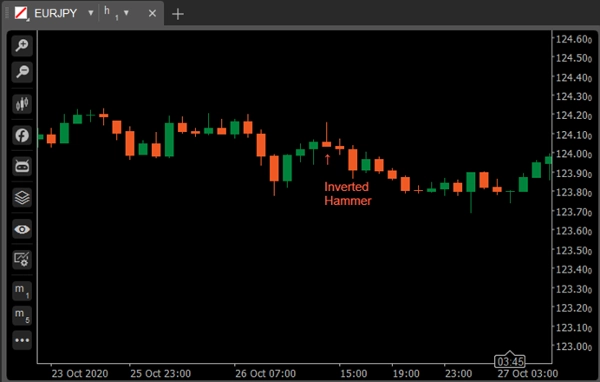
Перевернутый молот
Перевернутый молот — тип свечного паттерна, который появляется после нисходящего тренда и обычно считается сигналом разворота тренда.
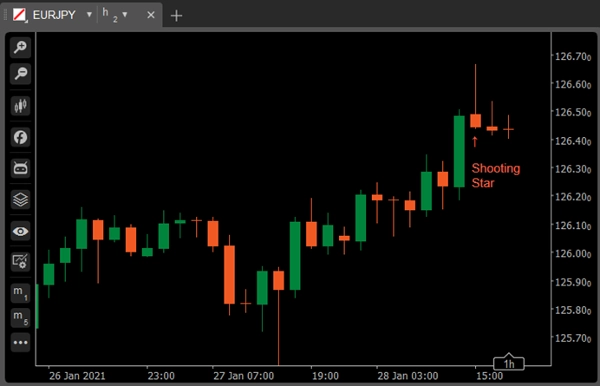
Вариация: Shooting Star
Shooting Star выглядит точно так же, как перевернутый молот, но вместо появления в нисходящем тренде он появляется в восходящем и имеет иные последствия.
Marubozu
Длинная или обычная свеча (красная или зеленая) без теней или хвостов. Максимум и минимум представляют цены открытия и закрытия. Считается паттерном продолжения.
Вариация: Marubozu Open
Для Marubozu open цена открытия должна быть ровной: то есть движение цены должно быть в одном направлении, но в отличие от полной свечи Marubozu, цена закрытия с другой стороны может немного отличаться от максимума/минимума. Другими словами, открытие должно быть ровным, при этом допускается короткая тень с другой стороны.
Вариация: Marubozu Close
Свеча Marubozu close противоположна Marubozu open: закрытие должно быть ровным, в то время как движение цены может немного смещаться в другую сторону, прежде чем начнется агрессивная торговля в одном направлении.
Бычье поглощение
Состоит из меньшего красного тела, которое содержится внутри следующей большой зеленой свечи. Когда появляется внизу, интерпретируется как сигнал крупного разворота.
Медвежье поглощение
Состоит из меньшего зеленого тела, которое содержится внутри следующей большой красной свечи. Когда появляется вверху, считается сигналом крупного разворота.
Piercing Line
Piercing Line состоит из красной свечи, за которой следует зеленая свеча, открывающаяся ниже минимума предыдущей, но закрывающаяся более чем наполовину внутри тела красной свечи. Считается сигналом разворота, когда появляется внизу.
Dark Shadow Cover
Состоит из длинной зеленой свечи, за которой следует красная свеча, открывающаяся выше максимума зеленой свечи и закрывающаяся глубоко внутри тела зеленой свечи. Считается медвежьим сигналом разворота во время восходящего тренда.
Бычий Harami
Состоит из необычно большого красного тела, за которым следует маленькое зеленое тело (внутри большого красного). Считается бычьим паттерном, если предшествует нисходящий тренд.
Вариация: Bullish Harami Cross
Большое красное тело, за которым следует доджи. Считается сигналом разворота, когда появляется внизу.
Медвежий Harami
Медвежий Harami состоит из необычно большого зеленого тела, за которым следует маленькое красное тело (внутри большого зеленого). Считается медвежьим паттерном, если предшествует восходящий тренд.
Вариация: Bearish Harami Cross
Большое зеленое тело, за которым следует доджи. Считается сигналом разворота, когда появляется вверху.
Бычий/Медвежий Kicker
Сигнал Bullish Kicker часто возникает после крупного сюрприза в новостях, объявленного до или после торговых часов. Произошло что-то резкое, вызвавшее значительный сдвиг в настроениях инвесторов, и неизбежно последует разворот. Чем больше разрыв между двумя свечами, тем значительнее сигнал.
Утренняя/Вечерняя звезда
Состоит из большой зеленой свечи, за которой следует маленькая свеча (красная или зеленая), открывающаяся с гэпом выше предыдущей. Третья — красная свеча, закрывающаяся глубоко внутри большого зеленого тела. Считается сигналом разворота, когда появляется на вершине.
Вариация: Abandoned Baby
Три зеленых солдата/Три красных вороны
Состоит из трех длинных зеленых свечей с последовательным повышением закрытий. Цены закрытия близки к максимумам или на них. Когда появляется внизу, интерпретируется как сигнал разворота снизу.
Состоит из трех длинных красных свечей с последовательным понижением закрытий. Цены закрытия близки к минимумам или на них. Когда появляется вверху, считается сигналом разворота сверху.
Three Line Strike
Three line strike — это группа из трех свечей в направлении тренда, за которыми следует последняя свеча, возвращающаяся к начальной точке. Трейдеры используют three line strike как возможность купить на недавнем минимуме тренда или продать на недавнем максимуме.
Two Red Gapping
Медвежий паттерн продолжения two red gapping появляется после заметного максимума в восходящем тренде с гэпом вниз, который приводит к двум красным барам с более низкими минимумами. Этот паттерн предсказывает, что снижение продолжится до еще более низких минимумов.
Сводка
Отзывы покупателей
5 | 100 % | |
4 | 0 % | |
3 | 0 % | |
2 | 0 % | |
1 | 0 % |


