
ATR Bands
Индикатор
5 покупки
Версия 1.0, Oct 2025
Windows, Mac
4.6
Отзывы: 3
Описание
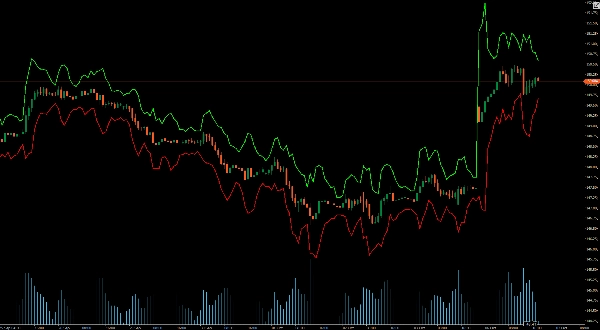
ATR Bands динамически отображают верхние и нижние полосы на ваших ценовых графиках.
Эти полосы предоставляют информацию о волатильности рынка в реальном времени, помогая точно определить потенциальные точки прорыва и разворота. Идеально подходят для трейдеров любого уровня, ATR Bands улучшают процесс принятия решений, предоставляя четкие визуальные подсказки для установки стоп-лоссов, тейк-профитов и оптимизации точек входа.
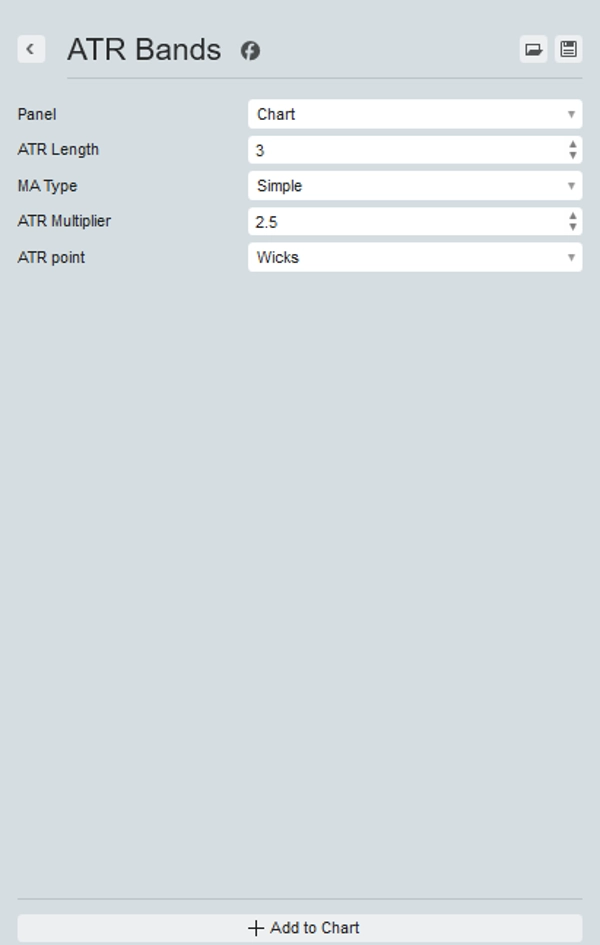
Настройки позволяют выбрать предпочтительный период и множитель, изменить скользящую среднюю, используемую для расчёта ATR, а также использовать фитили свечей или закрытие свечи.
Обновите свой торговый набор инструментов уже сегодня и ощутите разницу с ATR Bands – вашим преимуществом на рынке.
Сводка
ИИ-сводка
ATR Bands is a trading indicator that dynamically plots upper and lower bands on price charts based on the Average True Range (ATR). These bands provide real-time visualization of market volatility, assisting traders in identifying potential breakout and reversal points. The indicator supports customizable settings, including the choice of period and multiplier, selection of the moving average type used to calculate ATR, and the option to base calculations on candle wicks or candle closes. ATR Bands are applicable across various markets such as Forex, cryptocurrencies (e.g., BTCUSD), commodities, indices, and stocks. By offering clear visual cues, this tool aids in optimizing entry points, as well as setting stop-loss and take-profit levels.
Профиль индикатора
Отзывы покупателей
4.6
Отзывы: 3
5 | 67 % | |
4 | 33 % | |
3 | 0 % | |
2 | 0 % | |
1 | 0 % |
Отзывы покупателей
October 19, 2025
weak entries have a harder time slipping through, but risk control still needs say no.
October 14, 2025
The better read comes from there is a useful pause before the click, and a few signals across sessions tell more.
October 13, 2025
Обсуждение
Частые вопросы
BTCUSD
Forex
Breakout
Indices
EURUSD
Commodities
GBPUSD
NZDUSD
Prop
Crypto
Stocks
XAUUSD
NAS100
ATR
USDJPY
Продукты, доступные в cTrader Store, включая торговых ботов, индикаторы и плагины, предоставляются сторонними разработчиками и доступны исключительно в информационных и технических целях. cTrader Store не является брокером и не предоставляет инвестиционные консультации, персональные рекомендации или какие-либо гарантии будущей доходности.


Цена
С 25/09/2025
25
Продажи
315
Бесплатные установки