
Consolidation Zones
Индикатор
1 покупки
Версия 1.0, Oct 2025
Windows, Mac
4.0
Отзывы: 1
Описание
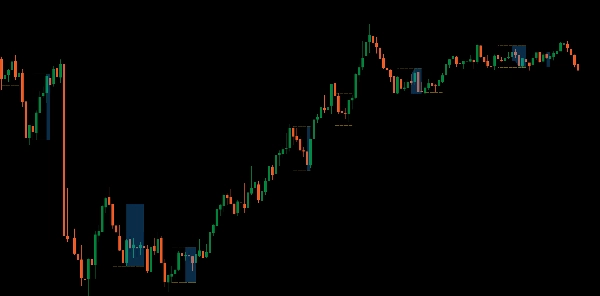
Представляем индикатор Consolidation Zones, созданный, чтобы помочь вам легко выявлять и использовать возможности прорыва.
Этот мощный инструмент выделяет зоны на вашем графике, где цена консолидируется, что упрощает обнаружение потенциальных точек прорыва. Визуализируя эти критические области, вы можете лучше предсказывать движения рынка и принимать более обоснованные торговые решения.
Идеально подходит для трейдеров, стремящихся улучшить свою стратегию с помощью четких и практических идей, обновите свой торговый набор инструментов и овладейте прорывами с индикатором Consolidation Zones.
Сводка
ИИ-сводка
The Consolidation Zones indicator identifies and visualizes price consolidation areas on trading charts to help traders spot potential breakout points. By highlighting these zones, it assists in anticipating market movements and supports more informed decision-making. This tool is applicable across multiple markets, including Forex, cryptocurrencies (e.g., BTCUSD), commodities (e.g., gold, oil), indices (e.g., NAS100, SP500), and stocks. It is designed to enhance trading strategies focused on breakout opportunities by providing clear visual cues of consolidation phases.
Профиль индикатора
Отзывы покупателей
4.0
Отзывы: 1
5 | 0 % | |
4 | 100 % | |
3 | 0 % | |
2 | 0 % | |
1 | 0 % |
Отзывы покупателей
October 12, 2025
Two timeframes give more context, and the log becomes easier to read.
Обсуждение
Частые вопросы
BTCUSD
Forex
Breakout
Indices
EURUSD
Commodities
GBPUSD
NZDUSD
Prop
Crypto
Stocks
XAUUSD
NAS100
USDJPY
Продукты, доступные в cTrader Store, включая торговых ботов, индикаторы и плагины, предоставляются сторонними разработчиками и доступны исключительно в информационных и технических целях. cTrader Store не является брокером и не предоставляет инвестиционные консультации, персональные рекомендации или какие-либо гарантии будущей доходности.


Вам также может понравиться


![Логотип продукта "Gaussian Channel [Iridio Capital]"](https://cdn.ctrader.com/image/webp/7c039209-5573-4a54-a072-f9528b503103_41960)


Цена
С 25/09/2025
25
Продажи
315
Бесплатные установки