
Description
Présentation de l'indicateur avancé QQE (Estimation Qualitative Quantitative), un outil puissant qui combine deux indicateurs QQE pour des analyses de trading améliorées.
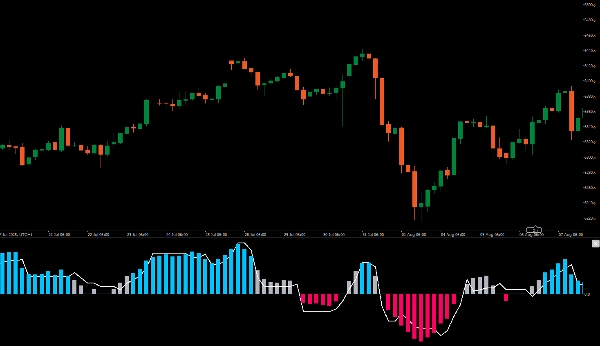
Un QQE est affiché sur le graphique sous forme de colonnes, tandis que l'autre fonctionne en arrière-plan avec une bande de Bollinger de 50 périodes servant de ligne zéro.
Cette configuration vous permet d'évaluer visuellement le momentum du marché et d'identifier clairement les points d'entrée potentiels. Lorsque les deux indicateurs QQE s'alignent, vous verrez des barres bleues ou rouges nettes, signalant de fortes opportunités d'achat ou de vente.
Élevez votre stratégie de trading avec l'indicateur QQE pour des décisions plus éclairées et une meilleure précision dans votre analyse de marché. Présentation de l'indicateur avancé QQE (Estimation Qualitative Quantitative), un outil puissant qui combine deux indicateurs QQE pour des analyses de trading améliorées.
Un QQE est affiché sur le graphique sous forme de colonnes, tandis que l'autre fonctionne en arrière-plan avec une bande de Bollinger de 50 périodes servant de ligne zéro.
Cette configuration vous permet d'évaluer visuellement le momentum du marché et d'identifier clairement les points d'entrée potentiels. Lorsque les deux indicateurs QQE s'alignent, vous verrez des barres bleues ou rouges nettes, signalant de fortes opportunités d'achat ou de vente.
Élevez votre stratégie de trading avec l'indicateur QQE pour des décisions plus éclairées et une meilleure précision dans votre analyse de marché.
Résumé
Avis clients
5 | 100 % | |
4 | 0 % | |
3 | 0 % | |
2 | 0 % | |
1 | 0 % |


![Logo de "[Stellar Strategies] Inside Bar with Signals"](https://cdn.ctrader.com/image/webp/1d9e8bfa-3b2c-4440-bb37-5856902008a7_30683)


