
Deskripsi
Memperkenalkan indikator TradingView ATR untuk cTrader, dirancang untuk menyesuaikan dengan presisi perhitungan Average True Range TradingView.
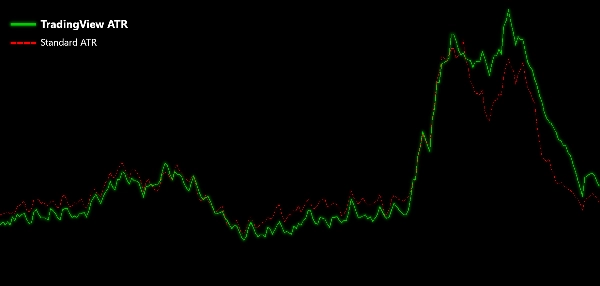
ATR yang ditingkatkan ini menggunakan Relative Moving Average (RMA) untuk perhitungannya, memberikan refleksi volatilitas pasar yang lebih akurat dibandingkan ATR default di cTrader. Dengan menggabungkan RMA, indikator ini menawarkan pembacaan volatilitas yang lebih halus dan responsif, membantu Anda membuat keputusan trading yang lebih tepat.
Sempurna untuk trader yang mencari akurasi lebih baik dalam analisis teknikal mereka, indikator ATR ini adalah alat yang kuat untuk meningkatkan strategi trading Anda.
Tingkatkan perlengkapan cTrader Anda dengan indikator ATR ini untuk wawasan volatilitas yang tepat dan dapat diandalkan.
Ringkasan
Ulasan pelanggan
5 | 100 % | |
4 | 0 % | |
3 | 0 % | |
2 | 0 % | |
1 | 0 % |


