
Weekly Daily Levels
Indikator
2 pembelian
Versi 1.0, Aug 2025
Windows, Mac
5.0
Ulasan: 2
Deskripsi
Apakah Anda mengandalkan harga OHLC harian dan mingguan serta titik tengah dalam strategi trading Anda? Bosan menandainya secara manual setiap kali Anda melakukan perdagangan?
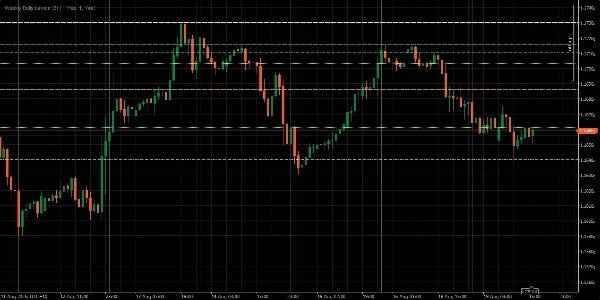
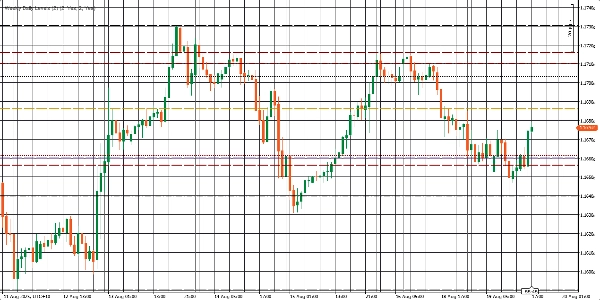
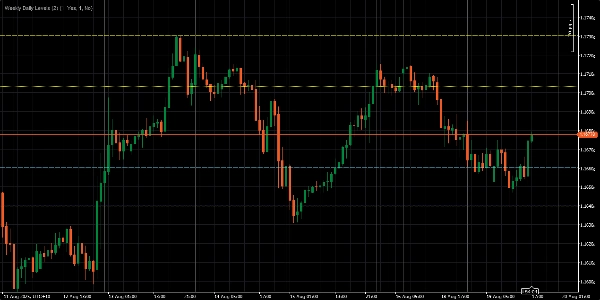
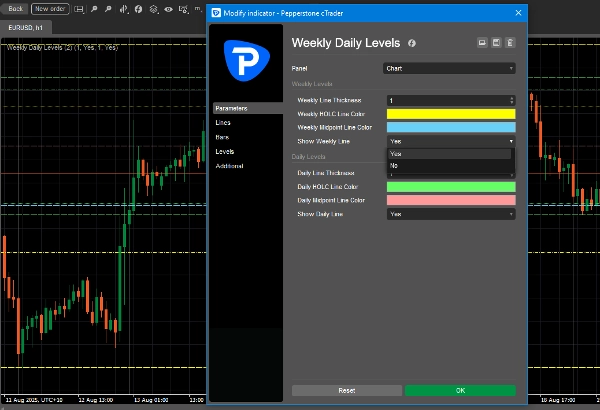
The Weekly Daily Levels Indicator melakukan pekerjaan berat untuk Anda. Ini secara otomatis memplot harga open, high, low, close (OHLC), dan titik tengah hari sebelumnya dan minggu sebelumnya langsung di grafik Anda. Ini berarti Anda dapat berkonsentrasi pada pelaksanaan strategi Anda sementara indikator mengurus detailnya—membuat trading Anda lebih sederhana, lebih cepat, dan jauh lebih efisien.
Fitur Utama:
- Menampilkan harga OHLC harian dan mingguan serta titik tengah secara instan.
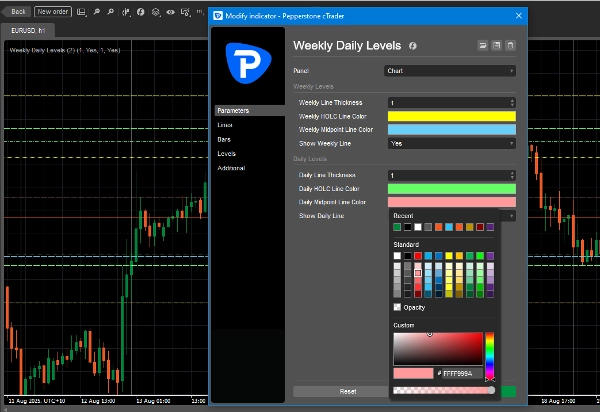
- Sesuaikan warna garis agar sesuai dengan gaya grafik Anda.
- Nyalakan atau matikan level harian atau mingguan dengan satu klik.
- Sesuaikan ketebalan garis untuk visibilitas yang lebih baik.
Ringkasan
Ringkasan AI
The Weekly Daily Levels indicator automatically plots the previous day’s and previous week’s open, high, low, close (OHLC) prices along with their mid-points directly on trading charts. It provides instant visual reference to these key price levels, helping traders incorporate daily and weekly price data into their strategies without manual marking. Users can customize line colors and thickness to fit their chart style and toggle daily or weekly levels on or off with a single click. This indicator streamlines the process of tracking important historical price levels for improved trading efficiency.
Profil indikator
Ulasan pelanggan
5.0
Ulasan: 2
5 | 100 % | |
4 | 0 % | |
3 | 0 % | |
2 | 0 % | |
1 | 0 % |
Ulasan pelanggan
August 28, 2025
Not bad if the rules are already clear. Two timeframes give more context.
August 21, 2025
the good surprise is the setup needs less second guessing, and It works better with a written plan.
Diskusi
Pertanyaan umum
Produk-produk yang tersedia melalui cTrader Store, termasuk bot trading, indikator, dan plugin, disediakan oleh pengembang pihak ketiga serta hanya ditujukan untuk akses teknis dan informasi. cTrader Store bukan broker dan tidak menyediakan saran investasi, rekomendasi pribadi, atau jaminan apa pun tentang kinerja di masa mendatang.


Harga
Sejak 19/04/2025
2
Penjualan