
Deskripsi
Indikator Toko Pinescriptlabs: Toko cBots Pinescriptlabs : (cBot) Gold & BTC BreakoutSession Pivots(baru)
Struktur Pasar Lanjutan: Bos, Choch, SwinLevels, Order Blocks, Pencari Struktur Pasar & Likuiditas (Baru)
Proyeksi Likuiditas Harga ZigZag
Algoritma Pintar Trailing (baru)
Prediksi Berdasarkan Linreg & ATR
Garis Dukungan &
Perlawanan SmartTrend
Lines
Analisis
Struktur Pasar
Dinamis
dari
Titik
Pembalikan
Regresi
Linear
Fibonacci
Multi-timeframe
Pelacak
Bias Lilin
Multi-Level
Garis
Dukungan dan
Perlawanan
Tren
Lines
Semua
Dukungan dan
Perlawanan
Level
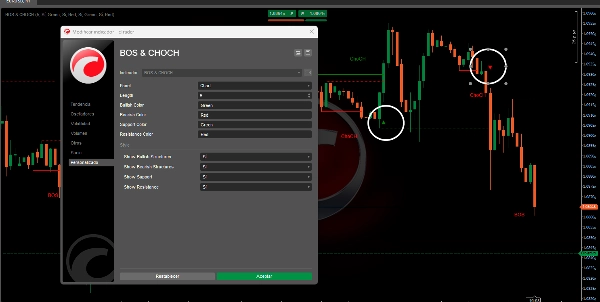
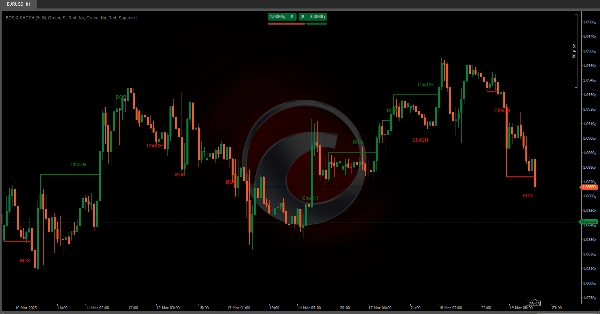
Algoritma ini dirancang untuk mengidentifikasi pola struktural pasar , khususnya konsep Perubahan Karakter (ChoCH) 🔄 dan Pecah Struktur (BoS) 💥. Di bawah ini, saya akan menjelaskan secara rinci apa yang dilakukan algoritma ini, tujuannya, dan bagaimana ia mengidentifikasi kedua konsep ini.
Apa yang Dilakukan Algoritma Ini?
Algoritma menggunakan fraktal (puncak dan lembah lokal) untuk menentukan apakah harga telah mengubah perilakunya atau memecahkan struktur yang sebelumnya telah ditetapkan. Berikut adalah fungsi utamanya:
Deteksi Fraktal 📊
- Sebuah fraktal bullish terjadi ketika ada puncak lokal di mana lilin di kedua sisi lebih rendah. 📈
- Sebuah fraktal bearish terjadi ketika ada lembah lokal di mana lilin di kedua sisi lebih tinggi. 📉
- Fraktal-fraktal ini berfungsi sebagai titik referensi untuk mengidentifikasi perubahan dalam struktur pasar.
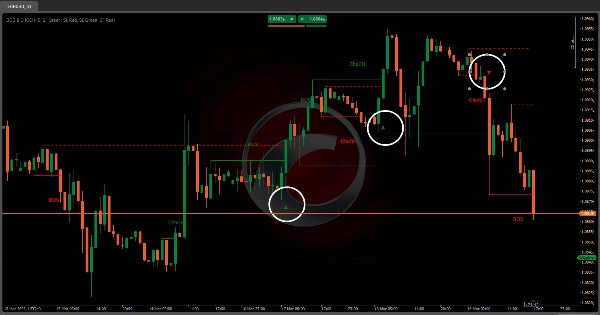
Identifikasi ChoCH (Perubahan Karakter) 🔄
- Sebuah ChoCH bullish terjadi ketika harga melewati fraktal bullish tanpa membentuk struktur bearish lengkap sebelumnya.
- Sebuah ChoCH bearish terjadi ketika harga jatuh di bawah fraktal bearish tanpa membentuk struktur bullish lengkap sebelumnya.
- Ini menunjukkan bahwa pasar telah mengubah karakternya (dari tren ke konsolidasi atau sebaliknya).
Identifikasi BoS (Pecah Struktur) 💥
- Sebuah BoS bullish terjadi ketika harga melewati fraktal bullish setelah membentuk struktur bearish lengkap sebelumnya.
- Sebuah BoS bearish terjadi ketika harga jatuh di bawah fraktal bearish setelah membentuk struktur bullish lengkap sebelumnya.
- Ini menunjukkan bahwa pasar telah memecahkan struktur yang sebelumnya telah ditetapkan, yang bisa menjadi titik masuk atau keluar yang penting.
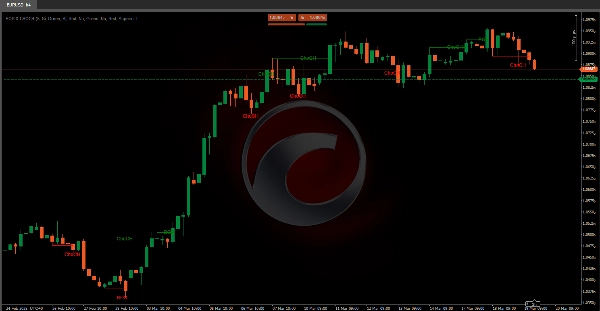
Visualisasi Dukungan dan Perlawanan 🛡️
- Algoritma dapat menggambar garis dukungan dan perlawanan berdasarkan fraktal yang terdeteksi.
- Ia juga memeriksa apakah garis-garis ini pecah, menandai titik breakout dengan ikon visual.
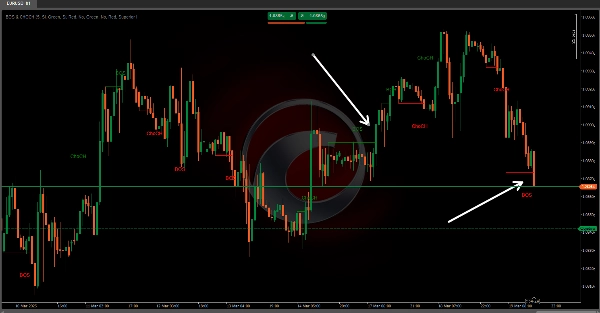
Algoritma ini memberikan wawasan berharga kepada para trader tentang perilaku pasar dengan mengidentifikasi dengan jelas perubahan struktural utama dan peluang breakout potensial. Dengan memanfaatkan ChoCH 🔄 dan BoS 💥 sinyal, trader dapat membuat keputusan yang lebih tepat tentang entri, keluar, dan dinamika pasar secara keseluruhan.
Ringkasan
Key functionalities include:
- **Fractal Detection:** Identifies bullish fractals (local highs with lower candles on both sides) and bearish fractals (local lows with higher candles on both sides).
- **Change of Character (ChoCH):** Signals when the market changes its behavior, such as shifting from trend to consolidation, by surpassing fractals without forming a complete opposite structure.
- **Break of Structure (BoS):** Indicates when the market breaks a previously established structure, marking potential entry or exit points.
- **Support and Resistance Visualization:** Draws support and resistance lines based on fractals and marks breakout points with visual icons.
This indicator aids traders in understanding market dynamics by clearly highlighting structural changes and breakout opportunities, supporting more informed trading decisions.
Ulasan pelanggan
5 | 100 % | |
4 | 0 % | |
3 | 0 % | |
2 | 0 % | |
1 | 0 % |


