Brokers & props
For business
00
Days
:
00
Hours
:
00
Minutes
:
00
Seconds
Indicator
RSI
Breakout
XAUUSD
Commodities
Supertrend
Crypto
BTCUSD
ICT Power of 3
5.0
03/09/2025
697
Desktop
Since 03/10/2024
Sales
127
Free installs
24797
"ICT Power of 3" uploaded image"ICT Power of 3" uploaded image"ICT Power of 3" uploaded image

Pinescriptlabs Store indicators:                        🤖Pinescriptlabs  Store cBots:


SmartTrend Support & Resistance Lines Gold & BTC Breakout Session Pivots(new) YieldShield" 🛡️

Fair Value Gap Sessions                      
       

ZigZag

 BOS & CHOCH

RSI Trend Trigger

Channel Breakout System

Supertrend

Market Imbalance

Adaptive Trend Channel 

Dynamic Market Structure
Analysis of Turning Points

Order Block

Fibonacci Linear
Regression Multi-timeframe

Volume POC Heatmap

Dynamic RSI

Momentum Fair Value Gap

Market Flow Projection

Dynamic Trend Gradient

Multi-Level Candle Bias
Tracker

Zig-Zag Extremity Tracker

Reactive Moving Average

Auto-Trend Channel

Auto Support and
Resistance Trend Lines

All Support and
Resistance Levels

Leverage Liquidation Map

Zones Supply Demand

Dynamic Range Momentum


ICT POWER OF 3 ⚡📊

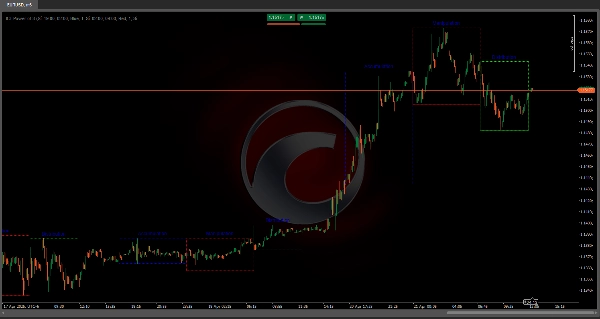
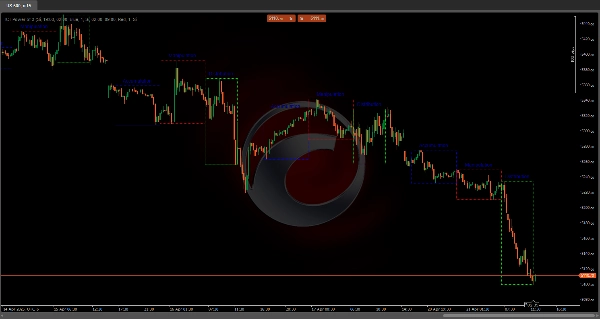
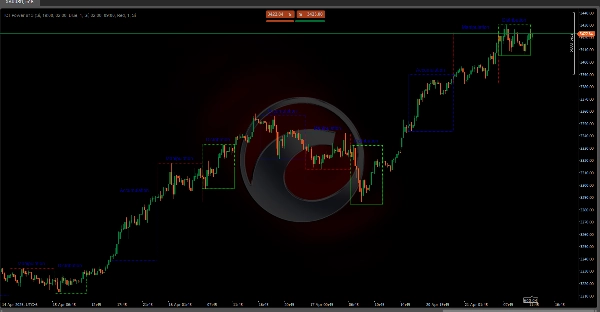
This indicator automates the ICT "Power of 3" theory by plotting three key market zones on your chart—Accumulation, Manipulation, and Distribution—using refined timeframes that capture both pure sessions and their overlaps. The result is a visual "map" 🗺️ showing where big players set supports, hunt stops, and drive trends—no manual candle or wick analysis needed!

Why This Algorithm Matters in Trading 💡

Institutional Visibility 👀: By automating the detection of zones where "Smart Money" accumulates, manipulates, and distributes, you remove guesswork and instantly see where the real liquidity flows.

Trap & Liquidity Detection 🎯: The Manipulation phase (Europe-NY overlap) is where stop hunts occur—spotting these lets you enter trades with lower risk.

Trend Confirmation 🚀: The pure NY Distribution zone captures the core of directional momentum—trading in sync with it boosts success rates.

Consistency 🔄: Using fixed timeframes and standardized visuals removes emotional bias and simplifies backtesting.


Detecting the Three Phases (Overlap Focus) 🔍

1️⃣ Accumulation (Asia + Tokyo/London Overlap: 7 PM – 2 AM EST)

  • Start ⏳: At the first 7 PM EST candle, a "box" opens, capturing the initial high/low.
  • Tracking 🔄: If price breaks the range (new high/low), the box expands in real time.
  • Close 🚪: At 2 AM EST, the box locks, marking where Smart Money absorbed orders with low volatility.

2️⃣ Manipulation (Europe + London/NY Overlap: 2 AM – 9 AM EST)

  • Start ⏳: Detected at the first 2 AM EST candle.
  • Behavior 🎭: Highlights false breakouts of prior extremes—each rejection is visually tracked.
  • Close 🚪: Ends at 9 AM EST, revealing where stop hunts were concentrated.

3️⃣ Distribution (Pure NY Session: 9 AM – 2 PM EST)

  • Start ⏳: Begins with the 9 AM EST candle.
  • Evolution 📈: The box grows with the strongest trend—where institutions release positions.
  • Close 🚪: Finalizes at 2 PM EST, marking the highest momentum & volume phase.

Day Management & Auto-Cleanup 🧹

To avoid chart clutter, the indicator keeps only the last N days (configurable). Once exceeded, it automatically deletes old zones—borders, fills, and labels—keeping your analysis clean & focused on recent data.

5.0
Reviews: 1
5
100 %
4
0 %
3
0 %
2
0 %
1
0 %
Customer reviews
May 30, 2025
Muito bom!
More from this author
Indicator
RSI
Breakout
XAUUSD
+6
ZigZag
ZigZag filters noise, spots trends, patterns, pivots, aiding analysis, trade management, and confirmations. 📉📈
Indicator
RSI
Breakout
XAUUSD
+6
Order Block
Identify bullish and bearish Order Blocks to spot key support/resistance levels and potential trend reversals! 📈🔄
Indicator
RSI
Breakout
XAUUSD
+5
Auto-Trend Channel
Adaptive trend channel using linear regression and Pearson correlation for dynamic support, resistance, and trends.
Indicator
RSI
XAUUSD
Breakout
+5
BOS & CHOCH
Market structural patterns , specifically the concepts of Change of Character (ChoCH) 🔄 and Break of Structure (BoS) 💥
Indicator
RSI
Breakout
XAUUSD
+6
Volume POC Heatmap
📊 Shows volume by price levels, highlights POC, and key zones. Identifies dynamic support/resistance and imbalances.
Indicator
RSI
Breakout
Supertrend
All Support and Resistance Levels
"Identify key market zones and visualize support/resistance from multiple timeframes on a single chart.
Indicator
RSI
Breakout
XAUUSD
+5
Zones Supply Demand
📊Zones Supply & Demand: Identifies key price levels with high volume concentration, marking Supply/Demand Zones & Marke
Indicator
RSI
Breakout
XAUUSD
+5
Supertrend
💹 Define a price channel 📈 and determine trend direction (bullish 🟢 or bearish 🔴).
Indicator
RSI
Breakout
XAUUSD
+6
Fair Value Gap Sessions
identify and highlight temporary market inefficiencies known as "fair value gaps" 🚨 within specific trading Sessions.
Indicator
RSI
Breakout
XAUUSD
+4
Dynamic Market Structure Analysis of Turning Points
Identify market structure effortlessly with swing highs, lows, CHoCH, and BOS levels for smart trading decisions! 📊🔍"
Indicator
Indices
RSI
XAUUSD
+7
RSI Divergence
Detects bullish and bearish divergences
Advanced Market Structure Bos,Choch,SwinLevels, Order Blog
Advanced price action tool that combines multiple technical analysis concepts
Indicator
RSI
Breakout
XAUUSD
+4
Multi-Level Candle Bias Tracker
Price direction by calculating the probability of reaching new highs/lows. Shows levels & stats📈
Indicator
RSI
Breakout
Supertrend
Trend Heikin Multi MA
🚀 TrendHeikinMultiMA: Advanced trend detection using Heikin-Ashi smoothing & MAs! Eliminates noise, confirms real trend
Indicator
RSI
Breakout
Supertrend
Swing Levels
🔍 Automatically detect support and resistance levels based on "swings" or pivots
Indicator
RSI
Breakout
Supertrend
Leverage Liquidation Map
📊 Liquidation Map: Potential areas where highly leveraged investors might face liquidations.
Indicator
RSI
Breakout
Supertrend
Market Trend OB
Price action to detect when the market changes trend (MSB) and defines, order blocks , ZigZag etc.📊
Indicator
NAS100
NZDUSD
XAUUSD
+9
PineScriptLabs Smart Signals CDRC Auto TPSL
🎯Smart Signals : Auto Buy/Sell alerts with dynamic TP/SL algorithm. 💡
You may also like
Indicator
Indices
Breakout
XAUUSD
+3
AnchoredVWAP
A precision overlay tool that combines session-aware VWAP logic and standard deviations.
Indicator
Indices
Commodities
Stocks
+4
IOFXVP
POC Order Blocks Pro: Alpha-Scored IOF Zones
Indicator
RSI
Breakout
Supertrend
+1
Momentum Fair Value Gap
It identifies areas of market imbalance (Fair Value Gaps or FVGs) and projects them on the chart in a smart way
Indicator
Breakout
XAUUSD
Prop
+4
Gold Inicial Balance Basic
Basic & FREE. Plots New York Initial Balance (NY local time) and projects IB High, IB Low, and midline.
IR CheckList
you could put your check list in your chart you could split your test with “,” you could put your checklist in indicat
Indicator
Breakout
Higher Timeframe Candlestick
Overlay a real-time higher-timeframe candle on your chart — color-coded bias without switching TFs.
Order Block Finder
Order Block Detector is built to spot and display Order Blocks on chart, often triggering strong price reactions.
Chaikin Money Flow
Chaikin money flow's primary purpose is to distinguish between periods of accumulation and distribution of a security.
Indicator
NAS100
Indices
NZDUSD
+9
MultiTimeFrame MovingAverage MTF MA
MultiTimeframe MA
Indicator
NAS100
NZDUSD
Indices
+8
ORB_BRSTrading
This indicator implements an Opening Range Breakout (ORB) trading strategy, designed to capture momentum during the most
Pivot Points
Pivot Points Indicator
Indicator
NAS100
NZDUSD
XAUUSD
+11
SwingHighLowDetector
Introducing High Accuracy multi timeframe Swing high and low detector.
Indicator
Forex
EURUSD
AI
Future_AI_Indicator
Future-AI indicator.
Indicator
NAS100
NZDUSD
Martingale
+26
ADVANCED ICT + ADR + AWR SUITE PRO
ADVANCED ICT + ADR + AWR SUITE PRO (The Ultimate All-in-One Toolkit for Price Action Traders)
Indicator
Indices
XAUUSD
Commodities
+5
cAlgoBuddy - Chaos Reversals
The cTrader Chaos Reversals indicator brings high-quality reversal signals to traders.
Top-rated
Free
FairValueGap
This Fair Value Gap (FVG) indicator is a technical analysis tool used to identify potential price imbalances.
HTF Candles
🌟 HTF indicator for cTrader! Real-time higher timeframe candles (1W-1H) on your chart.
Indicator
NAS100
Indices
NZDUSD
+9
VMM PositionPivotPro Trial
Professional position management! Calculate real-time pivots, monitor P&L & costs, and strengthen your strategy.