

Description
Pinescriptlabs Store indicators: Pinescriptlabs Store cBots : (cBot) Gold & BTC BreakoutSession Pivots(new)
PRICE ACTION (New)
Trailing Smart Algorithm (New)
Prediction Based on Linreg & ATR
SmartTrend Support &
Resistance
Lines
Dynamic
Market Structure
Analysis
of
Turning
Points
Fibonacci
Linear
Regression
Multi-timeframe
Auto
Support and
Resistance
Trend
Lines
All
Support and
Resistance
Levels
Description:
Advance HTF Trend Buy & Sell Trading System
What is it and what is it for?
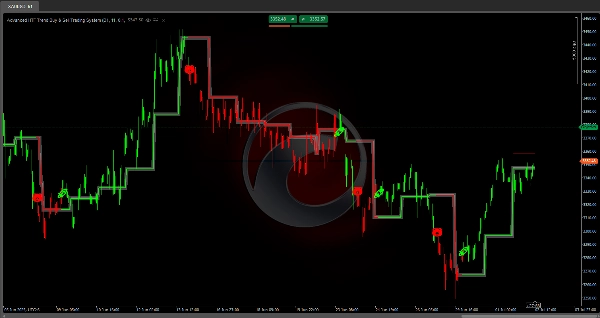
It’s a technical analysis algorithm that automatically identifies support and resistance levels 📈 based on historical price ranges, and detects when price breaks these levels to generate trend signals 💡.
How does the logic work?
1️⃣ Range Calculation
The indicator analyzes a defined historical period (fully configurable) to find:
• The highest price reached in that period 📊
• The lowest price reached in that period 📉
• The midpoint between both levels ⚖️
2️⃣ Level Establishment
Once the extremes are identified, the indicator:
• Draws a red line at the maximum level (resistance)
• Draws a green line at the minimum level (support)
• Adds a safety buffer to each level to prevent false signals 🛡️
3️⃣ Breakout Detection
The system constantly monitors the price to detect:
• Bullish breakout 🚀: when the price closes above the resistance level + buffer
• Bearish breakout 🐻: when the price closes below the support level - buffer
4️⃣ Confirmation System
Before generating a final signal ✅, the indicator:
• Waits for a configurable number of consecutive bars confirming the breakout ⏳
• Only after confirmation does it officially change the trend
5️⃣ Dynamic Updating
Levels are recalculated automatically:
• When a new period starts (daily, weekly, or monthly, depending on your settings) 🔄
• Lines extend until new levels are set
• The midpoint line changes color according to the current trend
How to Use the ?
✨ Signals:
• Buy: The 🚀 symbol appears when a bullish breakout is confirmed
• Sell: The 🐻 symbol appears when a bearish breakout is confirmed
🎨 Candle Coloring:
• Candles are automatically colored according to the current trend:
✅ Green: Active bullish trend
❌ Red: Active bearish trend
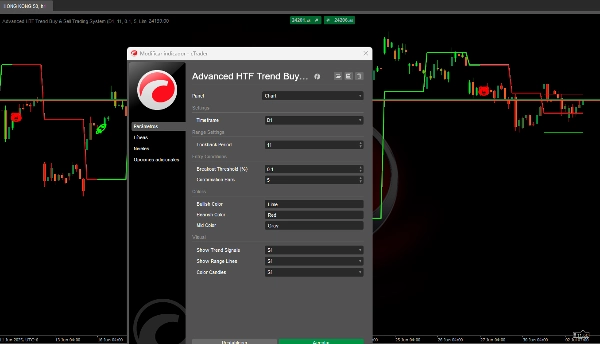
Parameter Settings
🔧 Lookback Period (5–200, default: 11)
What does it control?
The number of historical bars used to calculate highs and lows.
Impact when modified:
• Low values (5–15):
- More reactive and frequent levels
- Higher number of signals
- Best for scalping and short-term trades
- Ideal for highly volatile markets
• High values (30–50):
- More stable and lasting levels 🏛️
- Fewer but more reliable signals
- Better for swing trading and medium-term positions
- Ideal for more stable markets
📏 Breakout Threshold (0.01–5.0%, default: 0.1%)
What does it control?
The extra buffer the price must exceed to confirm a breakout.
Impact when modified:
• Low values (0.05–0.15%):
- Earlier and more sensitive signals 🔍
- Higher risk of false breakouts
- Ideal for Forex majors with low spreads
- Best for high liquidity markets
• High values (0.3–1.0%):
- Later but more reliable signals 🛡️
- Lower risk of market noise
- Ideal for cryptocurrencies and volatile assets
- Best for markets with wider spreads
⏳ Confirmation Bars (1–5, default: 1)
What does it control?
How many consecutive bars must confirm the breakout before generating a signal.
Impact when modified:
• 1 bar:
- Instant signals ⚡
- More trading opportunities
- Higher risk of premature signals
- Ideal for active traders
• 2–3 bars:
- Balance between speed and reliability ⚖️
- Significantly reduces false signals
- Ideal for most strategies
• 4–5 bars:
- Very conservative signals 🕊️
- Maximum reliability
- May miss early opportunities
- Ideal for long-term positions
📊 Optimization by Asset Type
💱 Forex Majors (EUR/USD, GBP/USD, etc.)
• Lookback: 15–25
• Threshold: 0.05–0.15%
• Confirmation: 1–2 bars
💰 Cryptocurrencies
• Lookback: 10–20
• Threshold: 0.2–0.8%
• Confirmation: 2–3 bars
📈 Stock Indices
• Lookback: 20–30
• Threshold: 0.1–0.3%
• Confirmation: 1–2 bars
🌾 Commodities
• Lookback: 25–35
• Threshold: 0.15–0.4%
• Confirmation: 2–3 bars
Considerations
• May generate late signals in very fast-moving markets 🏃♂️
• Less effective in extremely sideways markets
• Requires parameter adjustments depending on asset and timeframe ⏱️
Summary
The system continuously monitors price action to detect bullish breakouts (price closing above resistance plus buffer) and bearish breakouts (price closing below support minus buffer). It includes a confirmation mechanism that waits for a configurable number of consecutive bars confirming the breakout before officially signaling a trend change. The midpoint line changes color to reflect the current trend, and all levels update dynamically at the start of new periods (daily, weekly, or monthly).
Signals are visually indicated with symbols: a rocket (🚀) for confirmed bullish breakouts and a bear (🐻) for confirmed bearish breakouts. Candles are colored green for active bullish trends and red for bearish trends.
Key adjustable parameters include lookback period (5–200 bars), breakout threshold buffer (0.01–5.0%), and confirmation bars (1–5). These settings can be optimized for various asset types such as Forex majors, cryptocurrencies, stock indices, and commodities, balancing signal frequency, reliability, and market conditions. The indicator supports multiple timeframes and is suitable for scalping, swing trading, and longer-term strategies depending on configuration.


!["[Stellar Strategies] Market Structure Breakout" logo](https://cdn.ctrader.com/image/webp/bceec265-3247-4b11-915f-6295a29c106d_28465)


