Multi-Level Candle Bias Tracker
インジケーター
814 ダウンロード数
バージョン 1.0、Jan 2025
Windows、Mac
5.0
レビュー: 1
「Multi-Level Candle Bias Tracker」アップロード画像「Multi-Level Candle Bias Tracker」アップロード画像「Multi-Level Candle Bias Tracker」アップロード画像「Multi-Level Candle Bias Tracker」アップロード画像「Multi-Level Candle Bias Tracker」アップロード画像
登録日 03/10/2024
142
販売
30.99K
無料インストール

Pinescriptlabs Store indicators:                        Pinescriptlabs  Store cBots :  (cBot) Gold & BTC BreakoutSession Pivots(new)

Trailing Smart Algorithm (New)

S&R Structural ZigZag                                

ZigZag

 BOS & CHOCH

Zones Supply Demand

Leverage Liquidation Map

Auto-Trend Channel


Volume POC Heatmap


PREMIUM SSL CHANNEL

Prediction Based on Linreg & ATR

 ICT Power of 3 
                                                   

SmartTrend Support &
Resistance
Lines
       

Fair Value Gap Sessions           


RSI Trend Trigger

Channel Breakout System

Supertrend

Market Imbalance

Adaptive Trend Channel 

Dynamic
Market Structure
Analysis
of
Turning
Points

Order Block

Fibonacci
Linear
Regression
Multi-timeframe

Dynamic RSI

Momentum Fair Value Gap

Market Flow Projection

Dynamic Trend Gradient

Multi-Level
Candle Bias
Tracker

Zig-Zag Extremity Tracker

Reactive Moving Average

Auto
Support and
Resistance
Trend
Lines

All
Support and
Resistance
Levels

Dynamic Range Momentum

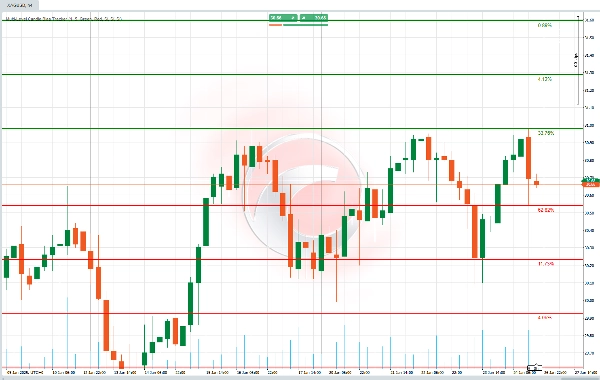
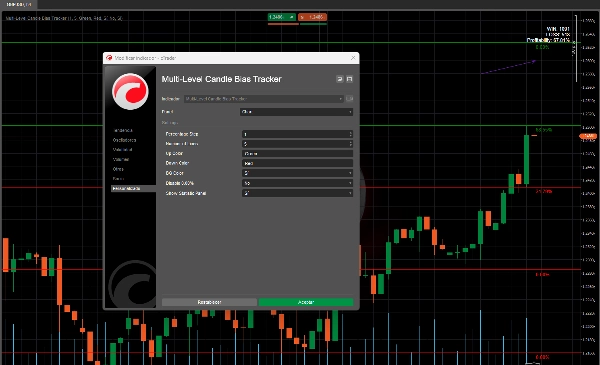
This algorithm determines the likelihood of the price reaching a new high or low and represents it as a level on the chart, accompanied by its corresponding percentage. This calculation is backtested, and the results are displayed in a table, making it easy to understand the probability of the next candle setting a new high or low. 📈📉

How does it work? 🛠️

  1. Probabilities of New Highs and Lows 🎯
    • The algorithm analyzes past price behavior to calculate the probability of the price making a new high or low in the next candle.
    • For example, if the probability of a new high is 70%, it’s more likely the price will go up. ⬆️
  2. Levels with Percentages 📏
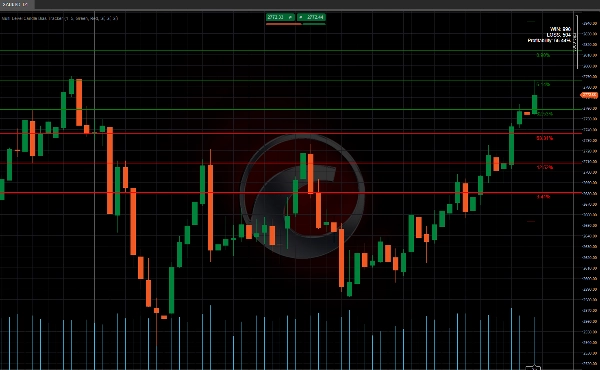
    • It draws horizontal lines on the chart representing key levels, along with a percentage indicating the probability of the price reaching that level.
    • These levels are calculated using a percentage you define (e.g., 1%).
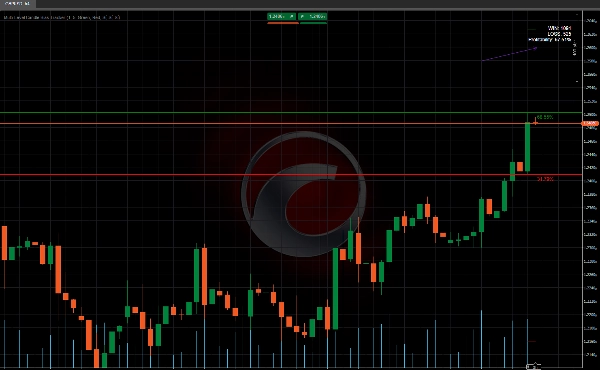
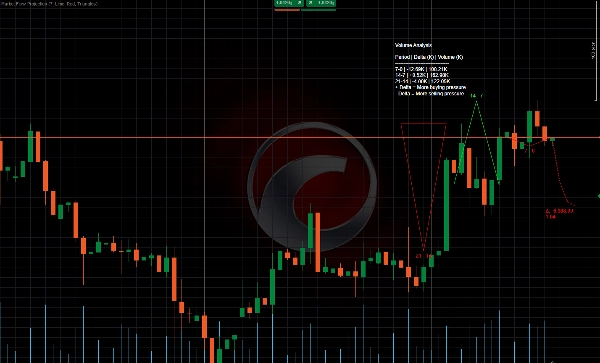
  3. Statistics Panel 📊
    • It shows how many times the price has reached those levels (successes) and how many times it hasn’t.
    • It also provides an effectiveness percentage, telling you if those levels have been reliable in the past. ✅❌

What is it for? 

  • Understand price direction: Helps you know whether the price is more likely to go up or down in the next candle. ⬆️⬇️
  • Manage risk: If a level has a low probability, you can avoid it to reduce risky decisions.

How would you use it? 

  1. Observe the levels: Look at the lines the algorithm draws on the chart. 👀
  2. Check the probabilities: If a level has a high probability (e.g., 70%), it’s more likely the price will reach it. 📈
  3. Use the statistics panel: Review whether those levels have worked well in the past to decide if you trust them. 📊


Indicator profile
5.0
レビュー: 1
5
100 %
4
0 %
3
0 %
2
0 %
1
0 %
カスタマーレビュー
July 14, 2025
Pros: Visualizes candle bias across multiple timeframes. Clean interface, helpful for multi-TF trend confirmation. Cons: No alerts or tooltips. Bias logic is basic. Lacks template saving and signal confirmation features.
RSI
Breakout
XAUUSD
Commodities
Supertrend
Crypto
BTCUSD
Products available through cTrader Store, including indicators, plugins and cBots, are provided by third-party developers and made available for informational and technical access purposes only. cTrader Store is not a broker and does not provide investment advice, personal recommendations or any guarantee of future performance.

この作成者の他の商品

「ZigZag」ロゴ
トップ評価
4.3
(6)
無料
ZigZag filters noise, spots trends, patterns, pivots, aiding analysis, trade management, and confirmations. 📉📈
Identify bullish and bearish Order Blocks to spot key support/resistance levels and potential trend reversals! 📈🔄
📊 Shows volume by price levels, highlights POC, and key zones. Identifies dynamic support/resistance and imbalances.
Market structural patterns , specifically the concepts of Change of Character (ChoCH) 🔄 and Break of Structure (BoS) 💥
Adaptive trend channel using linear regression and Pearson correlation for dynamic support, resistance, and trends.
"Identify key market zones and visualize support/resistance from multiple timeframes on a single chart.
📊Zones Supply & Demand: Identifies key price levels with high volume concentration, marking Supply/Demand Zones & Marke
💹 Define a price channel 📈 and determine trend direction (bullish 🟢 or bearish 🔴).
identify and highlight temporary market inefficiencies known as "fair value gaps" 🚨 within specific trading Sessions.
Identify market structure effortlessly with swing highs, lows, CHoCH, and BOS levels for smart trading decisions! 📊🔍"
Detects bullish and bearish divergences
📊 Liquidation Map: Potential areas where highly leveraged investors might face liquidations.

これも好きかも

インジケーター
NAS100
NZDUSD
+27
The profit and loss of your current trades are always displayed on the chart.
インジケーター
NAS100
Indices
+10
Session POC levels for Asia, London & NY with mitigation tracking for precise liquidity-based trading.
インジケーター
NAS100
NZDUSD
+27
MACD Sniper Elite Multi-Timeframe/ Spot trend strength across multiple timeframes with sniper-level clarity.
インジケーター
NAS100
NZDUSD
+16
Automate candle numbering for any N-bars and plot the High/Low of the last N periods. Fully customizable & Tab-toggle.
インジケーター
NAS100
NZDUSD
+12
ATR Band Channel – Spot high-probability reversals when price snaps back inside dynamic ATR bands. Built for precision.
インジケーター
XAUUSD
Commodities
+2
HTF POWER 3 ICT Power of 3 · M1 Precision · H4 Intelligence Auto-detect Accumulation → Manipulation → Distribution
インジケーター
NZDUSD
XAUUSD
+4
PSP is a professional-grade trading tool built to detect candle-level SMT divergence between correlated markets
インジケーター
NAS100
NZDUSD
+16
Inside Bars • Outside Bars • Strong Bars • Round Numbers • Smart EMA Momentum
インジケーター
NAS100
NZDUSD
+25
The truth lies in its unwavering nature. 【Defeate prospect theory.】
インジケーター
NAS100
NZDUSD
+27
SR Commander is a clean and intelligent support and resistance indicator for cTrader, built to help traders identify key
インジケーター
NAS100
NZDUSD
+13
Hurst HCCO Advanced / Cycle Phase Detection / Volatility Filter / Info Table / Momentum Histogram
インジケーター
NAS100
NZDUSD
+15
MACD Advanced -- It combines the standard MACD logic with a rich set of visual tools
登録日 03/10/2024
142
販売
30.99K
無料インストール