Indicator
RSI
Breakout
XAUUSD
ATR
Commodities
Signal
Supertrend
Crypto
BTCUSD
Market Imbalance
"Market Imbalance" logo
03/09/2025
424
Desktop
Since 03/10/2024
Sales
105
Free installs
16420
"Market Imbalance" uploaded image

Pinescriptlabs Store indicators:                        Pinescriptlabs  Store cBots :  (cBot) Gold & BTC BreakoutSession Pivots(new)

S&R Structural ZigZag                                

ZigZag

 BOS & CHOCH

Zones Supply Demand

Leverage Liquidation Map

Auto-Trend Channel


Volume POC Heatmap


PREMIUM SSL CHANNEL

Prediction Based on Linreg & ATR

 ICT Power of 3 
                                                   

SmartTrend Support &
Resistance
Lines
       

Fair Value Gap Sessions                


RSI Trend Trigger

Channel Breakout System

Supertrend

Market Imbalance

Adaptive Trend Channel 

Dynamic
Market Structure
Analysis
of
Turning
Points

Order Block

Fibonacci
Linear
Regression
Multi-timeframe

Dynamic RSI

Momentum Fair Value Gap

Market Flow Projection

Dynamic Trend Gradient

Multi-Level
Candle Bias
Tracker

Zig-Zag Extremity Tracker

Reactive Moving Average

Auto
Support and
Resistance
Trend
Lines

All
Support and
Resistance
Levels

Dynamic Range Momentum

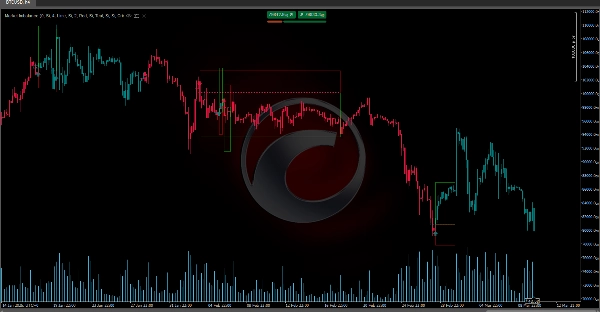
MarketImbalanceDetector identifies market imbalances and visually marks key areas based on price patterns and volatility (ATR). Here’s a simple breakdown of how it works:

🔍 Signal Detection

It compares prices of previous bars to detect bullish or bearish patterns. Using specific conditions (like comparing lows and highs of previous bars) and filtering signals with current volatility, it ensures the movement is significant.

📊 Visualizing Imbalances

When a signal is identified, the indicator draws on the chart:

  • An Imbalance Area (a rectangle) marking the zone where the pattern occurred.
  • An Average Level Line (calculated from relevant highs and lows) to help visualize support or resistance.
  • An Icon (an arrow) indicating the signal direction (⬆️ for bullish, ⬇️ for bearish).

OP/PE Zones

Additionally, it creates zones called OP () and PE (Escape Point). These zones are calculated by adding or subtracting a multiple of the ATR to the average level, helping define areas for taking profit or cutting losses.


0.0
Reviews: 0
Customer reviews
No reviews for this product yet. Already tried it? Be the first to tell others!
More from this author
Indicator
RSI
Breakout
XAUUSD
+6
ZigZag
ZigZag filters noise, spots trends, patterns, pivots, aiding analysis, trade management, and confirmations. 📉📈
Indicator
RSI
Breakout
XAUUSD
+6
Order Block
Identify bullish and bearish Order Blocks to spot key support/resistance levels and potential trend reversals! 📈🔄
Indicator
RSI
Breakout
XAUUSD
+5
Auto-Trend Channel
Adaptive trend channel using linear regression and Pearson correlation for dynamic support, resistance, and trends.
Indicator
RSI
XAUUSD
Breakout
+5
BOS & CHOCH
Market structural patterns , specifically the concepts of Change of Character (ChoCH) 🔄 and Break of Structure (BoS) 💥
Indicator
RSI
Breakout
XAUUSD
+5
Zones Supply Demand
📊Zones Supply & Demand: Identifies key price levels with high volume concentration, marking Supply/Demand Zones & Marke
Indicator
RSI
Breakout
Supertrend
All Support and Resistance Levels
"Identify key market zones and visualize support/resistance from multiple timeframes on a single chart.
Indicator
RSI
Breakout
XAUUSD
+6
Volume POC Heatmap
📊 Shows volume by price levels, highlights POC, and key zones. Identifies dynamic support/resistance and imbalances.
Indicator
RSI
Breakout
XAUUSD
+5
Supertrend
💹 Define a price channel 📈 and determine trend direction (bullish 🟢 or bearish 🔴).
Indicator
RSI
Breakout
XAUUSD
+6
Fair Value Gap Sessions
identify and highlight temporary market inefficiencies known as "fair value gaps" 🚨 within specific trading Sessions.
Indicator
RSI
Breakout
XAUUSD
+4
Dynamic Market Structure Analysis of Turning Points
Identify market structure effortlessly with swing highs, lows, CHoCH, and BOS levels for smart trading decisions! 📊🔍"
Indicator
Indices
RSI
XAUUSD
+7
RSI Divergence
Detects bullish and bearish divergences
Indicator
RSI
Breakout
Supertrend
Trend Heikin Multi MA
🚀 TrendHeikinMultiMA: Advanced trend detection using Heikin-Ashi smoothing & MAs! Eliminates noise, confirms real trend
Indicator
RSI
Breakout
XAUUSD
+4
Multi-Level Candle Bias Tracker
Price direction by calculating the probability of reaching new highs/lows. Shows levels & stats📈
Indicator
RSI
Breakout
Supertrend
Leverage Liquidation Map
📊 Liquidation Map: Potential areas where highly leveraged investors might face liquidations.
Indicator
RSI
Breakout
Supertrend
Market Trend OB
Price action to detect when the market changes trend (MSB) and defines, order blocks , ZigZag etc.📊
Indicator
RSI
Breakout
Supertrend
Zig-Zag Extremity Tracker
Dynamically adjusts regression channels based on ZigZag extremes, resetting when price breaks bands to track real trends
Indicator
RSI
Breakout
Supertrend
+3
Fibonacci Linear Regression Multi-timeframe
Combining Fibonacci levels and regression to analyze multidimensional market trends across multiple timeframes¡
Advanced Market Structure Bos,Choch,SwinLevels, Order Blog
Advanced price action tool that combines multiple technical analysis concepts
You may also like
Order Block Finder
Order Block Detector is built to spot and display Order Blocks on chart, often triggering strong price reactions.
Advanced Market Structure Bos,Choch,SwinLevels, Order Blog
Advanced price action tool that combines multiple technical analysis concepts
Indicator
NAS100
NZDUSD
Martingale
+26
Info Dashboard_noSourceCode
Read the market with AI: live sentiment, news impact, equity, spread & neural net signals in one dashboard.
VWAP-Free
VWAP only timeframe
Indicator
RSI
Breakout
Supertrend
+1
Reactive Moving Average
Combines SMA with dynamic correlation to adapt to market trends. Adjusts sensitivity, filters noise🚀📉
Indicator
NAS100
NZDUSD
Breakout
+12
Initial Balance Breakout Signals
📈 Initial Balance Breakout Signals: visually accurate IB levels, breakout alerts & forecast zones for smart trading.
MM-Symbol Info (free)
Enhance the trading experience with real-time Spread, Time To Close, rPNL, uPNL, PNL and minimalistic Bid / Ask lines
Indicator
RSI
Signal
MA-RSI HTF Confirmation
MA-RSI HTF Confirmation: Eliminate false signals and trade with confidence!
Indicator
NAS100
Indices
NZDUSD
+9
MultiTimeFrame MovingAverage MTF MA
MultiTimeframe MA
Laguerre RSI
Laguerre RSI is based on John EHLERS' Laguerre Filter to avoid the noise of RSI.
Indicator
Indices
Breakout
Prop
+2
Price Change Bundle 1.0 BT
Price Change Bundle 3-in-1 Levels • Bars • Histogram. Secret of Price Change
Indicator
NAS100
Indices
XAUUSD
+7
InstitutionalSignalOscillator
A precision-engineered indicator designed for traders who demand signal integrity across volatile markets.
Candelstick xxl
The indicator is designed to detect aggressive movements in the market and without volume for trend changes.
Indicator
NAS100
NZDUSD
Martingale
+26
CRT Indcator
CRTIndicator
LT_FairValueGap
Detects valid Fair Value Gaps from strong 3-bar patterns. Keep drawing unfilled gaps until price fills them.
50 percent
This indicater is a magical impact which shows exactly high and low with 100% results
Indicator
Breakout
XAUUSD
Prop
+4
Gold Inicial Balance Basic
Basic & FREE. Plots New York Initial Balance (NY local time) and projects IB High, IB Low, and midline.
Renko Moving Average Cross Indicator
The Renko Moving Average Cross indicator combines classic EMA crossover signals with Renko-filtered prices.