
AutoLines™ Support & Resistance
Indicador
2 compras
Versión 1.0, May 2025
Windows, Mac
4.5
Valoraciones: 4
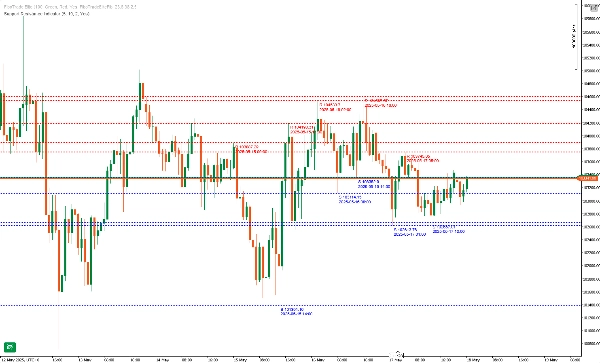
FlexSR es tu indicador profesional todo en uno de Soporte y Resistencia para cTrader. Identifica automáticamente los máximos y mínimos pivotantes durante el período de retroceso que elijas, traza hasta N de los niveles más recientes y los extiende a lo largo del gráfico. Con colores totalmente personalizables, estilos de línea, grosor y etiquetas opcionales de fecha-precio, FlexSR te ofrece zonas cristalinas donde es probable que el precio se detenga, revierta o rompa, para que puedas operar con confianza.
Características clave
Perfil del indicador
4.5
Valoraciones: 4
5 | 50 % | |
4 | 50 % | |
3 | 0 % | |
2 | 0 % | |
1 | 0 % |
Valoraciones de clientes
November 9, 2025
AutoLines™ S&R does the heavy lifting - clear, dynamic levels that adapt to price action. Perfect for traders who love clean charts and structure. Missing alerts, but performance and accuracy make it a must-have for support/resistance setups.
May 30, 2025
May 28, 2025
May 24, 2025
messy signals are easier to question, but overconfidence is the real danger.
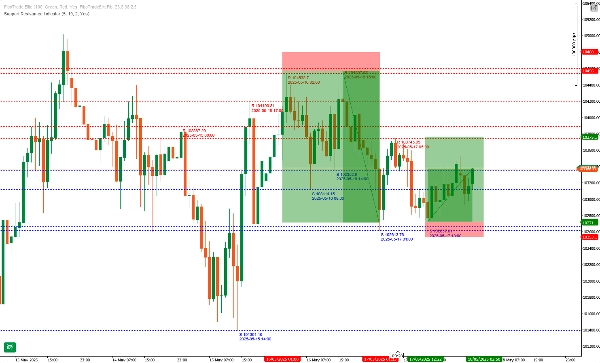
Breakout
Los productos disponibles a través de cTrader Store, incluidos bots, indicadores y plugins para operar, son proporcionados por desarrolladores de terceros y están disponibles únicamente con fines informativos y de acceso técnico. cTrader Store no es un bróker, por lo que no proporciona asesoramiento de inversión, recomendaciones personales ni ninguna garantía de rentabilidad futura.


Desde 22/11/2024
132
Ventas
2.56K
Instalaciones gratis