Indicator
Grid
NAS100
NZDUSD
Breakout
XAUUSD
Commodities
Martingale
Forex
Signal
EURUSD
GBPUSD
BTCUSD
Indices
Prop
Stocks
Crypto
USDJPY
Scalping
TS_Pivot
"TS_Pivot" logo
5.0
23/09/2025
3
Desktop
Since 22/09/2024
Sales
96
Free installs
8518
"TS_Pivot" uploaded image"TS_Pivot" uploaded image"TS_Pivot" uploaded image"TS_Pivot" uploaded image"TS_Pivot" uploaded image"TS_Pivot" uploaded image"TS_Pivot" uploaded image"TS_Pivot" uploaded image"TS_Pivot" uploaded image"TS_Pivot" uploaded image

Those who are involved in trading know how important it is to take into account the previous session.
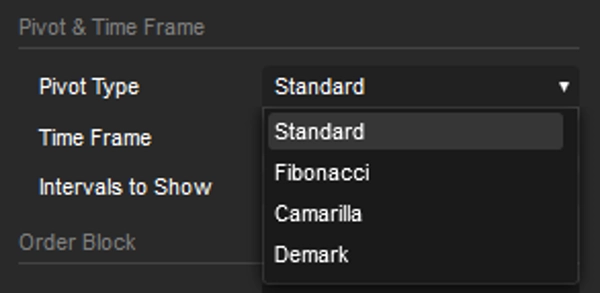
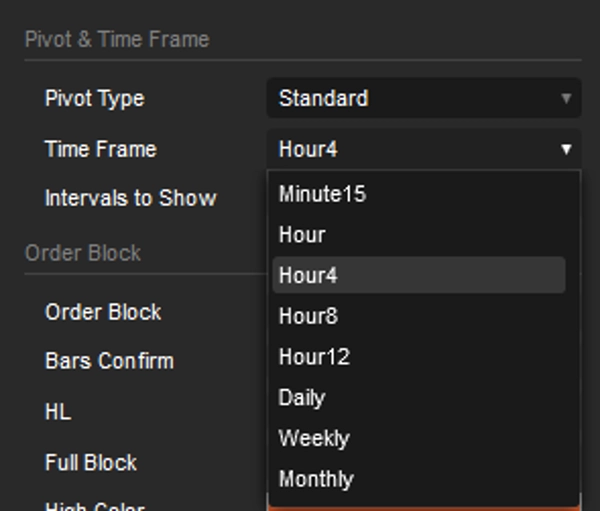
I have prepared this Pivot indicator, with intervals from 15 minutes up to a month, and it includes order blocks and trend lines. Both options are based on the highest and lowest points of the previous session.

The default configuration is set for a 5-minute timeframe.
The pivot is set to 4 hours, and the interval is 5, which means it looks back 20 hours in 4-hour intervals. This is perfect for those who trade daily.
However, if you are a fan of Swing Trading, you only need to change the Pivot interval; everything else adjusts automatically.

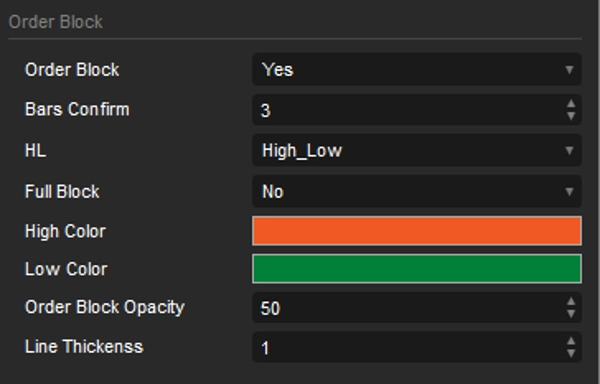
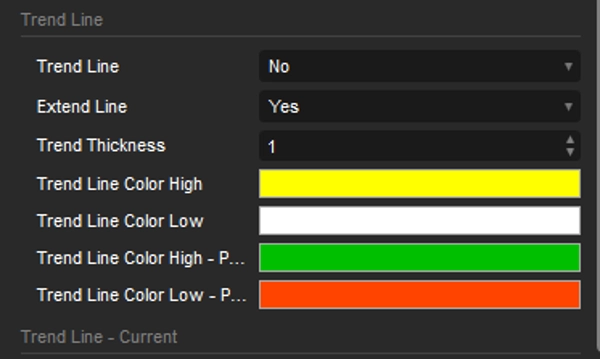
Order blocks highlight potential areas where the price could find support or resistance, offering insight into possible reversals or continuations. By combining them with the automatically generated trend lines for the chosen timeframe, traders can more accurately identify potential price direction and possible entry or exit points. The ability to visualize these trend lines across multiple timeframes provides a more complete understanding of market structure.

With additional tools like

OrderPrice V3 https://ctrader.com/products/397

NTMPICLL https://ctrader.com/products/327

Range Box Level https://ctrader.com/products/245

Or RangeBoxFibonacci https://ctrader.com/products/526

Market Session https://ctrader.com/products/94

MacdVolume https://ctrader.com/products/267

4MA https://ctrader.com/products/247

You will be invincible

Good luck 😀

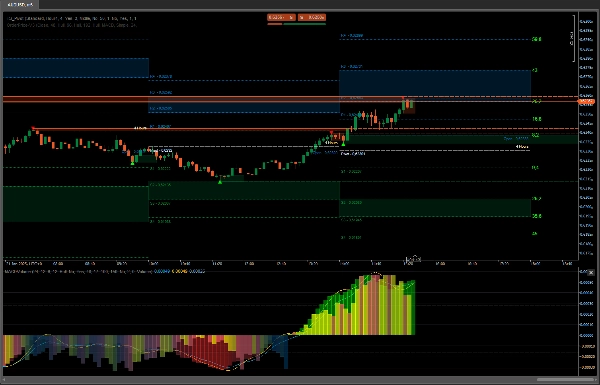
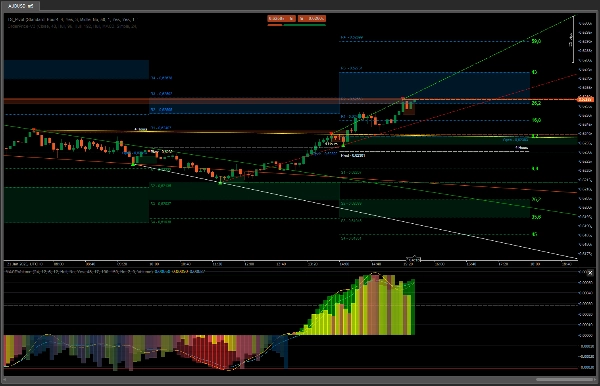
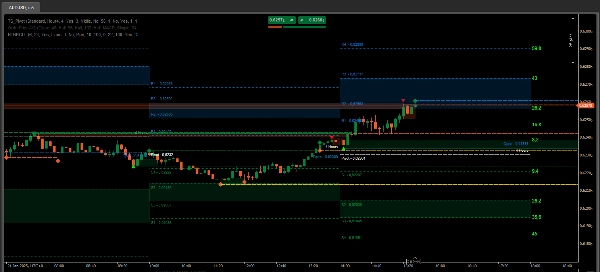
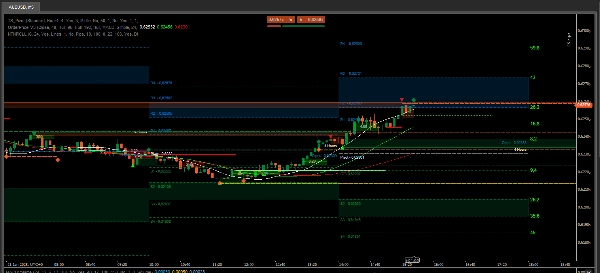
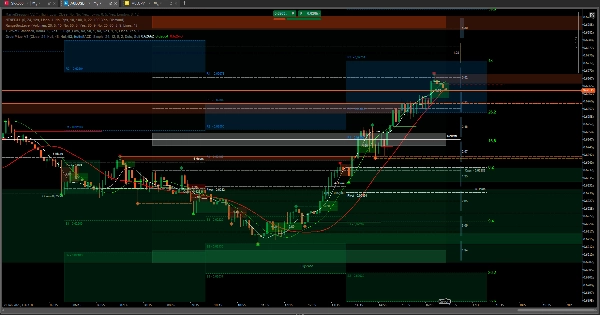
In the case of a buy, observing last two images the behavior of OrderPrice and the incorporated moving averages, when a green line appears and the moving average is below, it is the perfect moment to open a buy transaction.

With the data from the previous session, you can determine how far the price might go or where resistance might occur. If it breaks through, it may continue to the second point, which could be the neutral zone of RangeBoxLevel. If it surpasses that and there are no signs that the moving averages want to change direction, the price could reach the order block zone of the previous session.

In the last image, there is a screenshot of a perfect situation to enter and exit a transaction. The rest is just observing and drawing conclusions.

These tools are essential when it comes to winning through asset trading.


5.0
Reviews: 1
5
100 %
4
0 %
3
0 %
2
0 %
1
0 %
Customer reviews
August 28, 2025
A solid choice for beginner and intermediate traders seeking simple intraday levels. Advanced users will likely require more features such as alerts and multiple calculation modes.
More from this author
Indicator
Indices
Prop
Commodities
+3
4MA
This indicator consists of 3 moving averages that can be configured to your liking, from the type of moving average....
Indicator
NAS100
NZDUSD
XAUUSD
+10
MarketSession-MX
😎Read the description before purchasing💩
VWAP-Free
VWAP only timeframe
Indicator
Grid
NAS100
NZDUSD
+15
RangeBoxLevel
This technical analysis indicator provides information on market sentiment, trend and price levels....
cBot
Commodities
MACD
SparrowBot-FreeTrial-V2
This bot can automatically generate buy and sell orders based on three specific Fixed bugs
Indicator
Stocks
Forex
MACD
MACDVolume
😎Read the description before purchasing💩
Indicator
NAS100
NZDUSD
XAUUSD
+11
SessionOne
Session One is a tool for marking from to, useful if you've set the hours you want to trade
Indicator
Grid
NAS100
NZDUSD
+15
RangeBoxFibonacci
With this Fibonacci retracement indicator, traders have full control over the retracement levels displayed on the chart.
Indicator
Grid
NAS100
NZDUSD
+16
AllPattern
🔍 Discover All Candlestick Patterns… Absolutely Free!
Indicator
Grid
Indices
Prop
+8
TSPivotSMC
Pivot Point MultiTimeFrame with Order Block
Indicator
Indices
Prop
Stocks
+5
New Way Sar - Free
The Parabolic SAR, or "Stop and Reverse," is a dynamic technical analysis tool
Indicator
Indices
RSI
Commodities
+1
OrderPrice-V3
A straightforward yet effective tool signals entry points for both buying and selling. Include 3 Moving Average
Plugin
Breakout
Signal
RiskRewardCalculator
The Risk-Reward plugin is a tool to visualize a trading idea based on other analysis tools,
Indicator
RSI
Indices
Stocks
+3
FiboTrend-Pro
😎Read the description before purchasing💩
Indicator
NAS100
RSI
NZDUSD
+18
HAIQuantum-V10
The HAI Quantum V10 is an advanced indicator designed for technical analysis
Indicator
Indices
Prop
Stocks
+4
Pivot Point Smart Money Concept
Transform your approach to trading with our innovative Pivot Point Indicator.
Indicator
Indices
Prop
Breakout
+7
NTNPICLL
NTNPICLL is a tool to check the best trading hours for the assets and also includes the highest and lowest point
Indicator
RSI
Indices
Stocks
+3
FiboTrend-Pro V2
New version of one of my favorites includes Fibonacci and moving average convergence divergence lines
You may also like
session final
Comprehensive time session indicator
Indicator
NAS100
XAUUSD
Commodities
+11
SCOB
SCOB - Single Candle Order Block Indicator
[Hamster-Coder] Moving Average
Universal Moving Average indicator with extended features
Indicator
Prop
Forex
MM-Symbol Info (Pro)
NEW - PNLs as % - daily, weekly, monthly, or yearly & Spread, Time To Close, PNL Alerts, custom Bid / Ask lines
Quantitative Qualitative Estimation
The QQE (Quantitative Qualitative Estimation) Weighted Oscillator improves its original version by weighting the RSI.
Indicator
NAS100
NZDUSD
Breakout
+11
Consolidation Zones
Identify and trade breakouts with Consolidation Zones! Visualize price consolidation areas for trading opportunities.
Indicator
Grid
RSI
Breakout
+6
Final Stochastic Oscillator
Final Stochastic Oscillator is a next-generation upgrade of the classic stochastic indicator
Indicator
RSI
Breakout
XAUUSD
+5
Auto-Trend Channel
Adaptive trend channel using linear regression and Pearson correlation for dynamic support, resistance, and trends.
Indicator
Indices
Commodities
Stocks
+2
XY Bar Info Panel v1.5
Overlay panel showing bar date/time, OHLC, tick Volume, percent change, and market session - fully customizable.
SuperEmaColorRSI
This is a super indicator that integrates the RSI indicator with a dual moving average system.
Indicator
Indices
RSI
Forex
+1
Candle Pro
Candle Pro, Perfect for scalping, intraday, and swing trading.
Indicator
XAUUSD
Commodities
Forex
+5
BullBear Dynamics
BullBear Dynamics helps traders detect and interpret the balance between bullish and bearish momentum
Indicator
NAS100
NZDUSD
Breakout
+11
Previous day Key Levels
Previous day key levels indicator
Indicator
NAS100
Indices
XAUUSD
+4
BSL_SSL_Liqudity
Buy-Side & Sell-Side Liquidity (BSL/SSL) Indicator
Indicator
RSI
Breakout
Supertrend
+1
Momentum Fair Value Gap
It identifies areas of market imbalance (Fair Value Gaps or FVGs) and projects them on the chart in a smart way
MTF Candle Countdown
Stay ahead with a real-time countdown to candle closes on all key timeframes: 5m, 15m, 30m, 1H, 4H, and Daily.
Indicator
XAUUSD
Forex
EURUSD
+2
ALMA Smoothed Gaussian Moving Average
ALMA Smoothed Gaussian Moving Average (ASGMA) – by LudwigICT