"Linear Regression Oscillator" logo
Indicator
3 purchases
Version 1.1, Dec 2025
Windows, Mac
4.0
Reviews: 1
"Linear Regression Oscillator" uploaded image
29
Sales
1.94K
Free installs

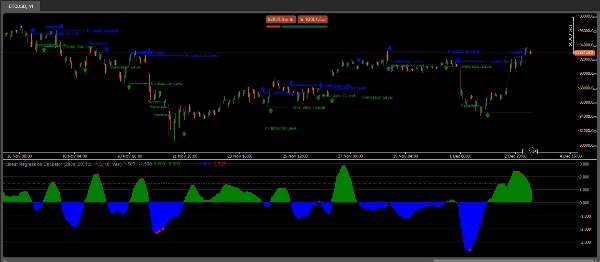
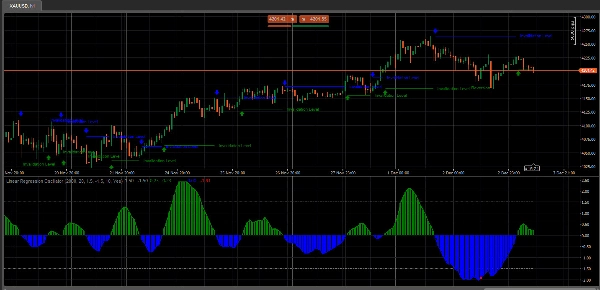
The Linear Regression Oscillator (LRO) is a technical indicator based on linear regression analysis, commonly used in financial markets to assess the momentum and direction of price trends. It measures the distance between the current price and the value predicted by a linear regression line, which is essentially the best-fit line over a specified period. Here’s a breakdown of how it works and its components:

Key Components of the Linear Regression Oscillator

  1. Linear Regression Line (Best-Fit Line): This line represents the expected price movement over a certain period and is calculated using linear regression techniques. The slope of the line indicates the trend's direction: a positive slope suggests an uptrend, while a negative slope points to a downtrend.
  2. Oscillator Values: The oscillator value is calculated by measuring the deviation between the current price and the linear regression line. This deviation is plotted as an oscillator value, typically oscillating around a zero line.
  3. Zero Line: The zero line in an LRO plot acts as a baseline. When the oscillator value crosses above the zero line, it suggests bullish momentum, and a cross below suggests bearish momentum.
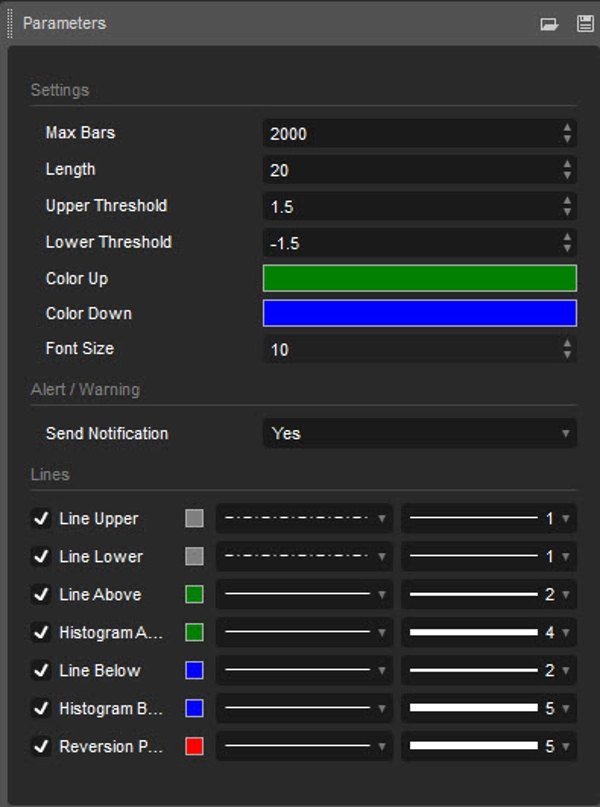
  4. Settings and Periods: The period setting defines the number of bars or data points considered for calculating the linear regression line. Traders adjust this setting to suit short-term or long-term trading strategies, depending on their preferred analysis timeframe.

How Traders Use the Linear Regression Oscillator

  • Identifying Trends: The LRO helps traders see if the current price trend has momentum by showing the relative distance between price and its expected (regression) line.
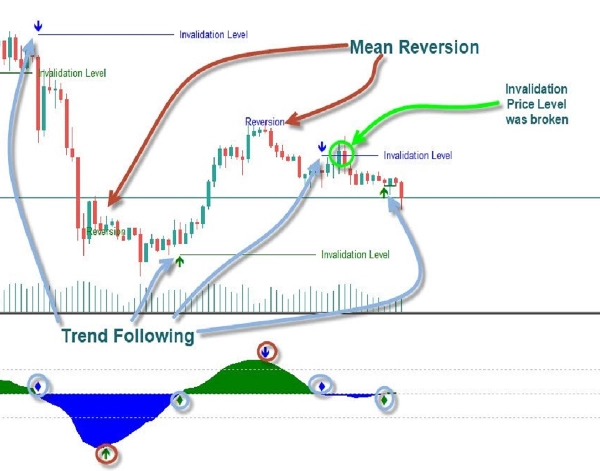
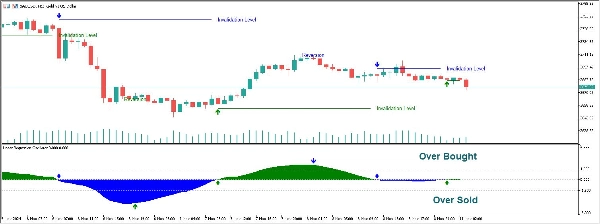
  • Overbought/Oversold Levels: Extreme values in the oscillator can indicate overbought or oversold conditions, suggesting a potential reversal or a need to adjust positions.
  • Divergence Signals: When price movements and the LRO indicator diverge, it can signal weakening momentum or a possible reversal.

Interpretation Tips

  • Crossing the Zero Line: A cross above zero may indicate an emerging uptrend, while a cross below zero suggests a downtrend.
  • Adjusting Periods: Shorter periods make the LRO more sensitive, capturing quick price movements but increasing noise. Longer periods smooth out fluctuations, suitable for identifying longer-term trends.

Usage Notes:

Length: Determines the period over which the linear regression is calculated

Upper/Lower Threshold: Define the upper and lower bounds for identifying overbought and oversold conditions. Values outside these thresholds suggest potential reversals.

The Linear Regression Oscillator is valued for combining statistical analysis with trend-following principles, making it a versatile tool for both momentum and trend traders. It’s particularly useful in trending markets where it helps identify trend continuations or reversals based on deviations from the regression trendline.

Indicator profile
4.0
Reviews: 1
5
0 %
4
100 %
3
0 %
2
0 %
1
0 %
Customer reviews
December 12, 2025
Demo first, then maybe small size if the notes look sane. The setup needs patience.
BTCUSD
Forex
Signal
Crypto
XAUUSD
NAS100
Products available through cTrader Store, including trading bots, indicators and plugins, are provided by third-party developers and made available for informational and technical access purposes only. cTrader Store is not a broker and does not provide investment advice, personal recommendations or any guarantee of future performance.

More from this author

Indicator
SMC
Forex
+7
The Fair Value Gap (FVG) Indicator identifies inefficiencies in price action where an imbalance occurs due to aggressive
Indicator
SMC
Forex
+7
Simple Smart Money Concepts (SMC)
Indicator
Forex
BTCUSD
+6
The Market Sessions indicator is a popular tool for visually representing global trading sessions on a price chart.
Indicator
Forex
BTCUSD
+6
All-In-One solution for ICT's FVG IFVG ORDERBLOCK in advanced mode.
Indicator
MACD
Forex
+5
MACD Indicator with Histogram that plots Colors Based on Direction Above and Below the Zero Line.
Indicator
SMC
Forex
+5
Pure Price Action ICT Tools
Indicator
Forex
BTCUSD
+5
Simple ICT Concepts
Indicator
Forex
BTCUSD
+5
This indicator displays the OrderBlocks of the current and higher timeframe, made by ICT's student.
Indicator
Forex
BTCUSD
+4
This indicator is designed to perform multiple non-linear regression analysis using four independent variables.

You may also like

Indicator
ATR
Forex
+3
LevelMaster S/R: Pinpoint key support & resistance zones with precision. Perfect for traders of all levels Trade smarter
Indicator
RSI
Signal
+2
Identifies trends with moving averages & volatility. Base levels = bullish 🐂 or bearish 🐻 signals. Reversals detected!
Indicator
Prop
Forex
+4
Displays real-time balance, equity, P&L, margin metrics directly on your charts.
Indicator
Volume
Key Levels
+1
Tape Reading indicator ,book and flow analysis
Indicator
Forex
Crypto
+6
Choppiness Index: identifies trending vs. ranging markets to filter breakouts and improve trend-following entries.
Indicator
EMA
RSI
+5
MACD Colour Histogram with 11 Moving Average Types, Multi-timeframe confirmation and Sound Signal Alert.
Indicator
Forex
Crypto
+3
This is a tool to help traders open orders/close orders/modify orders quickly with just one click
Indicator
Inducement
Key Levels
+5
Digital Clock Overlay that displays a live, second-by-second clock and optional date directly on the trading chart.
Indicator
E7 Correlation Dashboard.
Indicator
VWAP
Forex
+13
Custom VWAP Indicator for cTrader
Indicator
ATR
Trend-coloring Donchian cloud that highlights volatility squeezes and breakouts.
Indicator
Forex
BTCUSD
+12
🎯Automatically identifies the market's significant turning points (key H & L) and draws dynamic support and.....✍️
Indicator
ATR
Channel
+1
Bollinger Bands Advanced Squeeze & Breakout System, Real-Time On-Chart Dashboard, Auto-Squeeze Detector, Dual-Band Cloud
Indicator
ATR
SMC
+5
Candles Volume Delta is a powerful, visually intuitive indicator that transforms raw tick volume into actionable trading
Indicator
Moving Average
An Indicator made for scalping. Shows you the Sniper movement on Chart with the colour signals.
Indicator
AI
SMC
+5
Complete ICT Killzones: 5 sessions, easy colors, transparency controls & session info. Professional timing for cTrader.
Indicator
Forex
BTCUSD
+13
Sniper Zone Pro: High-precision institutional zones and candle strength for identifying key market tests.
Indicator
SMC
BTCUSD
+9
Detects CHoCH breakouts, draws interest zones & auto Fibo. Built for Smart Money & Price Action Engulfing confirmation
29
Sales
1.94K
Free installs