Brokers & props
For business
00
Days
:
00
Hours
:
00
Minutes
:
00
Seconds
Market Sessions Pre
Indicator
364 downloads
Version 1.0, Dec 2025
Windows, Mac
5.0
Reviews: 1
Since 27/11/2025
Sales
16
Free installs
1001
"Market Sessions Pre" uploaded image"Market Sessions Pre" uploaded image"Market Sessions Pre" uploaded image"Market Sessions Pre" uploaded image

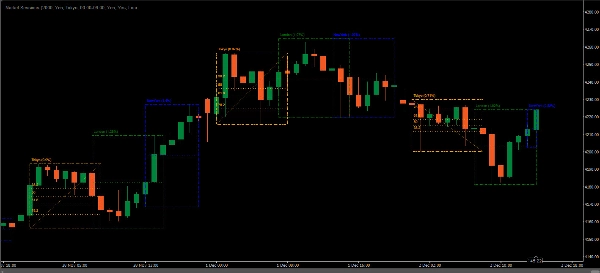
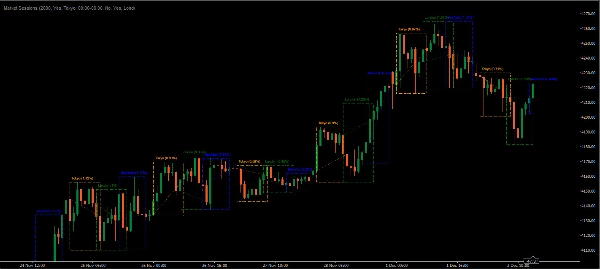
The Market Sessions indicator is a popular tool among forex and stock traders for visually representing global trading sessions on a price chart. It highlights the time periods for major trading sessions — such as the Asian (Tokyo)European (London), and American (New York) sessions — directly on the chart. This helps traders identify when markets open and close, allowing for better decision-making based on session-specific trading behavior.

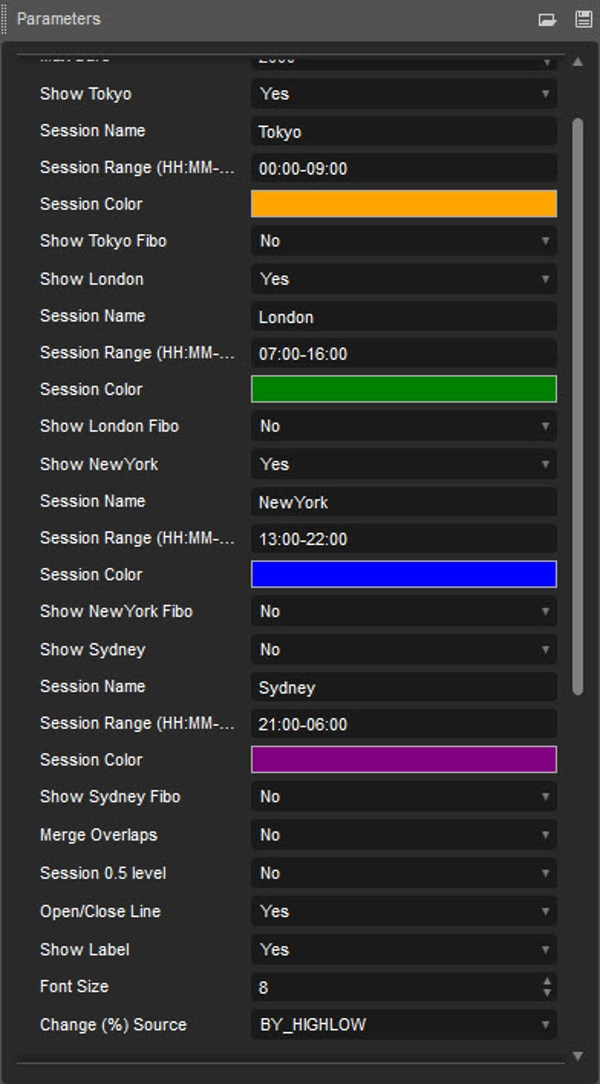
- Asian Session (Default: 00:00-09:00)

- London Session (Default: 07:00-16:00)

- New York Session (Default: 13:00-22:00)

- Sydney Session (Default: 21:00-06:00)

Key Features of the Market Sessions Indicator

  1. Session Timing and Overlaps:
    • The indicator marks the start and end times for each session. This feature is helpful as each session has unique characteristics — the Asian session, for example, is generally calmer, while the London session often sees high volatility. Overlaps, like the London-New York overlap, are marked as well, indicating times of increased activity.
  2. Customizable Session Colors:
    • Traders can often customize colors for each session, which makes it easy to visually distinguish between them. This personalization adds clarity and helps traders focus on particular sessions they may prefer.
  3. Adjustable Time Zones:
    • Since traders are located globally, the indicator usually allows for adjusting time zones, aligning session start and end times with the trader’s local time, which is particularly useful for those in different time zones than major trading centers.
  4. Session-Specific Strategies:
    • Each session has distinct characteristics. For example, the London session is often the most volatile, presenting breakout opportunities, while the Asian session tends to be calmer, which can suit range trading strategies. Understanding these nuances allows traders to tailor their strategies based on session trends.

Why Use the Market Sessions Indicator?

  1. Better Timing of Trades:
    • By knowing which session is active, traders can adjust their strategies to take advantage of different levels of volatility and liquidity.
  2. Improved Analysis and Strategy Development:
    • With session times visually marked, traders can analyze price behavior across sessions to develop and refine strategies that best suit each session's characteristics.
  3. Increased Awareness of Market Volatility:
    • Volatility often spikes during session openings, closings, and overlaps. The indicator helps in anticipating these moves, reducing the likelihood of being caught off-guard by sudden market shifts.

Example Use Case

A trader interested in volatility might target the London-New York overlap period to take advantage of higher market movement. By using the Market Sessions indicator, they can plan trades to coincide with this overlap, potentially increasing the chances of capturing significant price action.

In summary, the Market Sessions indicator is essential for traders who want to make informed decisions based on time-specific market behaviors. It provides clarity, enhances analysis, and can support more effective trading strategies.

5.0
Reviews: 1
5
100 %
4
0 %
3
0 %
2
0 %
1
0 %
Customer reviews
December 10, 2025
Market Sessions Pre highlights Asian, London and NY sessions with clear visual blocks. Perfect for intraday timing and volatility awareness. Lightweight, stable and clean. Great with SMC/ICT concepts. Would benefit from alerts and killzone markers, but already a highly useful tool.
NAS100
XAUUSD
Forex
Signal
EURUSD
Crypto
BTCUSD
Scalping

More from this author

Indicator
NAS100
XAUUSD
FVG
+6
Fair Value Gaps
The Fair Value Gap (FVG) Indicator identifies inefficiencies in price action where an imbalance occurs due to aggressive
Indicator
NAS100
XAUUSD
FVG
+6
Simple Smart Money Concepts
Simple Smart Money Concepts (SMC)
Indicator
NAS100
XAUUSD
Forex
+4
MACD Indicator NDH
MACD Indicator with Histogram that plots Colors Based on Direction Above and Below the Zero Line.
Indicator
NAS100
XAUUSD
Forex
+3
Linear Regression Oscillator
The Linear Regression Oscillator (LRO) is a technical indicator based on linear regression analysis.
Indicator
NAS100
XAUUSD
Forex
+4
Pure Price Action ICT Tools
Indicator
NAS100
XAUUSD
FVG
+5
Fair Value Gaps with Order Block Detector
All-In-One solution for ICT's FVG IFVG ORDERBLOCK in advanced mode.
Indicator
NAS100
XAUUSD
FVG
+4
Simple ICT Concepts
Simple ICT Concepts
Indicator
NAS100
XAUUSD
Forex
+3
Multiple Non-Linear Regression
This indicator is designed to perform multiple non-linear regression analysis using four independent variables.
Indicator
NAS100
XAUUSD
Stocks
+4
Orderblock Detector
This indicator displays the OrderBlocks of the current and higher timeframe, made by ICT's student.

You may also like

Indicator
Indices
Breakout
XAUUSD
+6
TMAX RBA 2026 ULTRA
🚀 TMAX RBA Indicator - The Ultimate Multi-Timeframe Momentum System 🚀
Indicator
Indices
RSI
Prop
+4
CG Swing Signal
One of the best indicators we have ever developed, with a very high profit ratio.
Indicator
Fibonacci
Anchored Moving Average
Anchor a moving average to any point on the chart and watch it extend dynamically as price evolves.
Indicator
NAS100
Indices
Prop
+6
VolumeThermometer
Heatmap of intra-HTF volume (POC/VA) built from LTF tick data; paints current candle and auto-loads visible history.
Indicator
NAS100
NZDUSD
XAUUSD
+15
SuperTrend from TradingView
Get the exact SuperTrend experience from TV, now perfectly rebuilt for cTrader
Indicator
NAS100
XAUUSD
Stocks
+4
Orderblock Detector
This indicator displays the OrderBlocks of the current and higher timeframe, made by ICT's student.
Indicator
Indices
Prop
Stocks
+3
Equity and Balance
Displays real-time balance, equity, P&L, margin metrics directly on your charts.
Indicator
Breakout
Stocks
Signal
Darvas Box
The Darvas Box involves identifying "boxes" or trading ranges where a stock's price consolidates before breaking out.
Indicator
NAS100
NZDUSD
Breakout
+14
MA Quant Smart Money Concepts
MA Quant Smart Money Concepts est un indicateur professionnel d'analyse technique avancée pour cTrader.
Indicator
NAS100
NZDUSD
Breakout
+18
Free Smart Money Concepts (SMC) from TradingView
Free Smart Money Concepts from TradingView for cTrader: BOS/CHoCH, OB, FVG, liquidity, MTF levels, discount zones.
Indicator
NAS100
NZDUSD
Breakout
+10
UT Bot
Trend-following indicator with dynamic ATR-based trailing stop for precise entry/exit signals
Indicator
Indices
RSI
Signal
+2
[Stellar Strategies] Ultimate Trend & Momentum Dashboard
A comprehensive cTrader indicator designed to give you a quick, at-a-glance understanding of market sentiment 📈📉