
supertrend
Indicator
5 purchases
Version 1.0, May 2025
Windows, Mac
4.3
Reviews: 3
Description
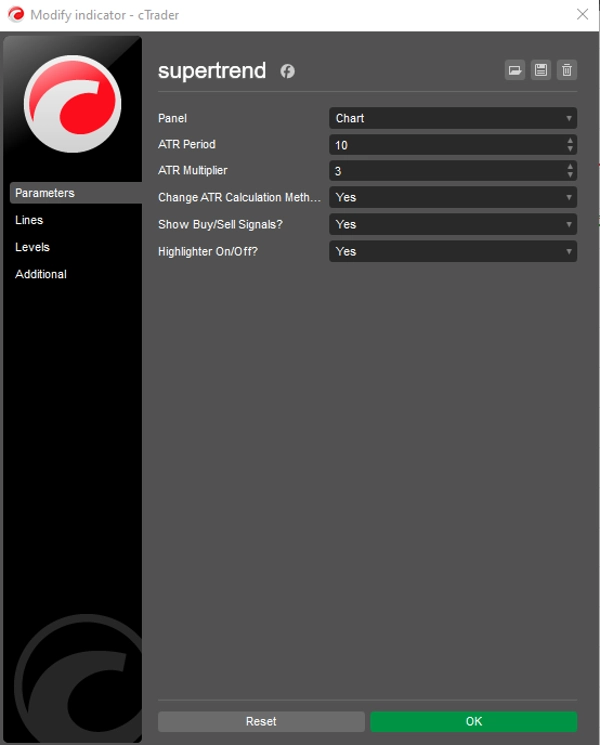
Supertrend Indicator for cTrader
The Supertrend Indicator is a powerful and versatile trend-following tool designed to help traders identify market trends and potential entry/exit points with ease. Built for the cTrader platform, this indicator leverages the Average True Range (ATR) to calculate dynamic support and resistance levels, providing clear visual signals for bullish and bearish trends. Its simplicity and effectiveness make it a favorite among traders of all experience levels, from scalpers to long-term investors.
Summary
AI summary
The Supertrend Indicator for cTrader is a trend-following tool that helps traders identify market trends and potential entry and exit points. It uses the Average True Range (ATR) to calculate dynamic support and resistance levels, providing clear visual signals for bullish and bearish trends. Designed for use on the cTrader platform, this indicator supports markets including Forex and indices. Its straightforward design makes it suitable for traders of various styles and experience levels, from scalpers to long-term investors. The indicator outputs trend strength signals based on bar data, aiding in market analysis without opening positions automatically.
Indicator profile
Indicator category
Trend
Output type
Signals
Data requirements
Bars only
Supported signals
Trend strength
Customer reviews
4.3
Reviews: 3
5 | 67 % | |
4 | 0 % | |
3 | 33 % | |
2 | 0 % | |
1 | 0 % |
Customer reviews
June 3, 2025
Practical entry check for traders who prefer directional setups. It gives value around trend filtering, but sideways markets can weaken the signal. The signal feels safer when trend strength is clear and DD stays under 3 percent. It is a filter for bias, not a reason to ignore risk.
June 2, 2025
June 2, 2025
Clean confirmation helper for trend filtering. it helps keep attention on the broader move, especially when used for filtering out random countertrend ideas. I would judge the trend read across 3 sessions, with at least 2 higher timeframe candles agreeing. It is a filter for bias, not a reason to ignore risk.
Discussion
FAQ
Prop
Forex
Signal
Indices
Supertrend
ATR
Products available through cTrader Store, including trading bots, indicators and plugins, are provided by third-party developers and made available for informational and technical access purposes only. cTrader Store is not a broker and does not provide investment advice, personal recommendations or any guarantee of future performance.


Price
Since 30/05/2025
40
Sales