
support and resistance
Indikator
13 pembelian
Versi 1.0, Jun 2025
Windows, Mac
4.3
Ulasan: 3
Ciri-ciri Utama:
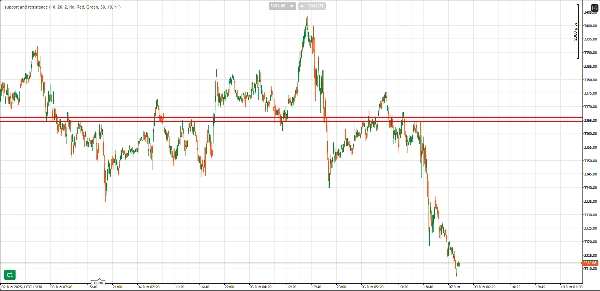
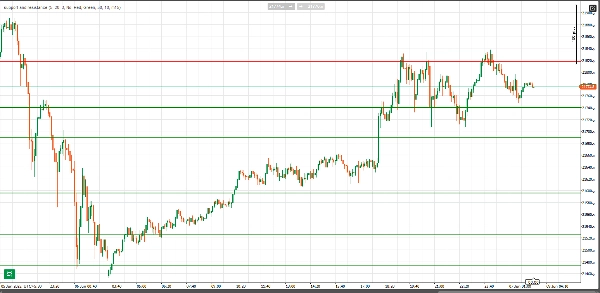
- Pengesanan Automatik Sokongan dan Rintangan: Penunjuk secara automatik mengenal pasti tahap sokongan dan rintangan yang penting berdasarkan tindakan harga, menonjolkan zon-zon ini di mana harga telah berbalik atau berhenti beberapa kali.
- Pengesahan Kiraan Pantulan: Tahap sokongan dan rintangan disahkan berdasarkan bilangan pantulan (reaksi harga) dari tahap tersebut. Semakin banyak pantulan, semakin kuat tahap itu. Anda boleh melaraskan kiraan pantulan minimum untuk tahap dianggap sah, memastikan hanya tahap yang sangat penting ditandakan.
- Gaya Garisan Boleh Laras: Ketebalan dan gaya garisan sokongan dan rintangan secara automatik disesuaikan berdasarkan kiraan pantulan. Tahap dengan lebih banyak pantulan dilukis dengan garisan yang lebih tebal dan menonjol, menekankan kepentingannya secara visual.
- Lebar Zon (Pips): Anda boleh menentukan zon penampan di sekitar tahap sokongan dan rintangan dalam pips. Ini membantu dalam mengenal pasti tindakan harga dalam julat di mana harga berpotensi berbalik atau bertindak balas.
- Penapis Masa Lebih Tinggi: Ciri unik penunjuk ini adalah keupayaannya untuk mengesahkan tahap sokongan dan rintangan menggunakan penapis masa lebih tinggi. Dengan memilih jangka masa lebih tinggi (contohnya, 1H, 4H), penunjuk menyemak silang tahap yang dikenal pasti dengan tindakan harga utama pada jangka masa lebih tinggi, memastikan hanya tahap penting yang dilukis pada carta.
- Amaran: Apabila harga memasuki zon tahap sokongan atau rintangan, penunjuk boleh memberi amaran dengan bunyi audio, supaya anda tidak terlepas reaksi harga yang penting.
- Warna Boleh Disesuaikan: Anda boleh dengan mudah menukar warna garisan sokongan dan rintangan mengikut citarasa anda atau selaras dengan tema dagangan anda.
- Pencegahan Pertindihan: Penunjuk termasuk penapis ambang yang menghalang lukisan tahap sokongan dan rintangan yang bertindih dan terlalu hampir antara satu sama lain, memastikan hanya tahap unik dan penting dipaparkan.
Manfaat:
- Jimat Masa: Mengesan dan memvisualisasikan tahap sokongan dan rintangan utama secara automatik tanpa perlu melukis secara manual.
- Visual Jelas: Mudah melihat tahap sokongan dan rintangan yang paling penting berdasarkan pantulan harga dan pengesahan jangka masa lebih tinggi.
- Amaran Berkesan: Terima amaran tepat pada masanya apabila tindakan harga memasuki tahap penting, membantu anda bertindak dengan cepat dan cekap.
- Keputusan Dagangan Lebih Baik: Gunakan penunjuk ini untuk mendapatkan lebih keyakinan dalam kemasukan dan keluar anda, serta analisis teknikal keseluruhan anda.
Pilihan Penyesuaian:
- Bar Lihat Kembali: Laraskan sejauh mana penunjuk melihat ke belakang untuk mengenal pasti tahap sokongan dan rintangan yang berpotensi.
- Pantulan Minimum: Tetapkan bilangan minimum pantulan yang diperlukan untuk tahap dianggap sah.
- Jangka Masa Lebih Tinggi: Tapis tahap sokongan dan rintangan berdasarkan jangka masa lebih tinggi (contohnya, carta 1 jam, 4 jam).
- Warna Garisan: Pilih warna untuk garisan rintangan dan sokongan mengikut gaya carta anda.
- Tetapan Amaran: Aktifkan atau nyahaktifkan amaran berdasarkan harga memasuki zon sokongan atau rintangan.
Profil indikator
Kategori indikator
Sokongan & rintangan
Jenis output
Visualisasi
Keperluan data
Bar sahaja
Isyarat yang disokong
Terobosan
Pembalikan
4.3
Ulasan: 3
5 | 33 % | |
4 | 67 % | |
3 | 0 % | |
2 | 0 % | |
1 | 0 % |
Ulasan pelanggan
June 11, 2025
Nice setup companion for a more controlled workflow. It helps with planning entries and exits around important areas, but not every zone holds, even if it looks clean. The cleanest use is 3 to 5 levels per chart, with 0.5 pullbacks checked before entry. I would still keep manual review in the process.
June 10, 2025
June 10, 2025
Decent option for checks around key price zones. The useful part is planning entries and exits around important areas, with the numbers checked before scaling. I would wait for 2 reactions and avoid trades where the target is less than 1.5R. Levels are useful when they reduce noise, not when they crowd the chart.
BTCUSD
Prop
Forex
Breakout
Indices
EURUSD
Commodities
GBPUSD
NZDUSD
XAUUSD
NAS100
USDJPY
Produk yang tersedia melalui cTrader Store, termasuk bot dagangan, indikator dan plugin, disediakan oleh pembangun pihak ketiga dan diberikan akses untuk tujuan maklumat dan teknikal sahaja. cTrader Store bukan broker dan tidak memberikan nasihat pelaburan, syor peribadi atau sebarang jaminan prestasi masa hadapan.


Sejak 30/05/2025
40
Jualan