
Descripción
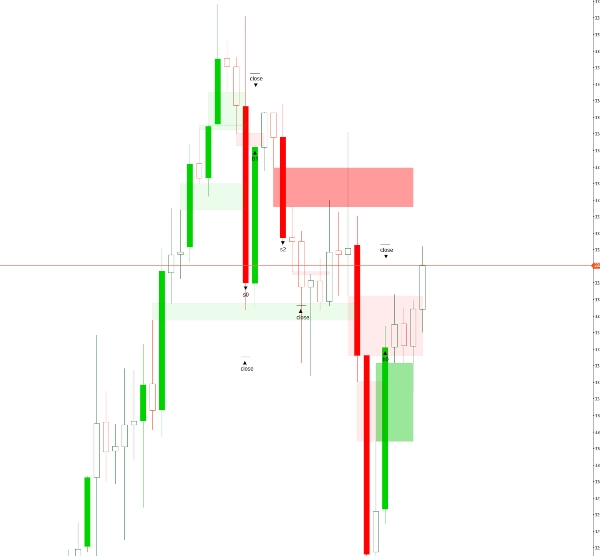
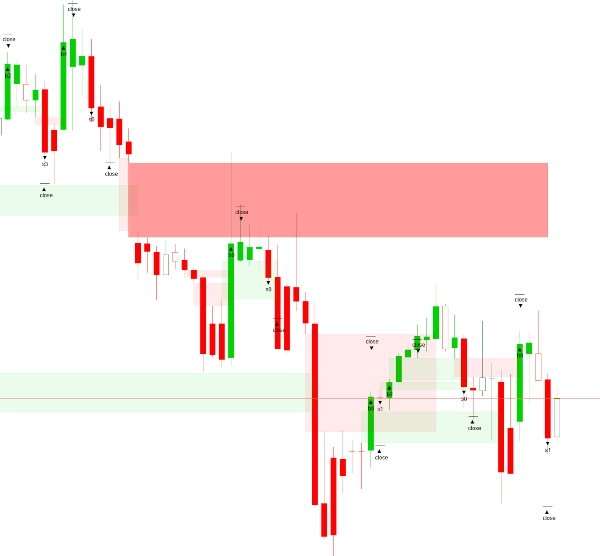
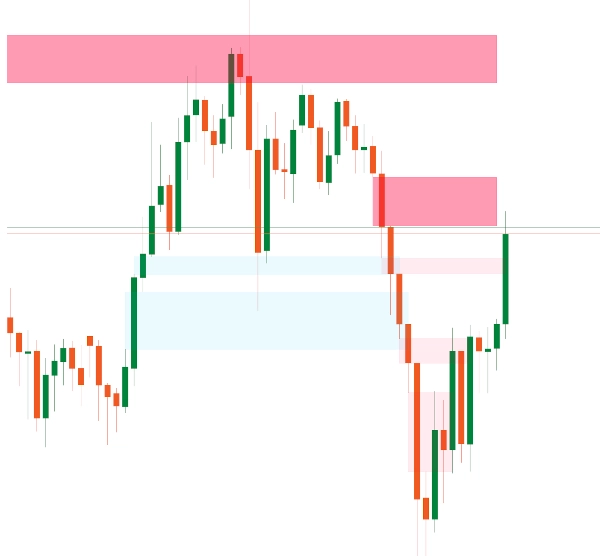
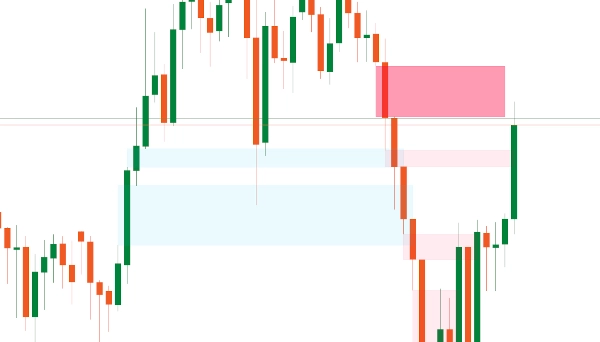
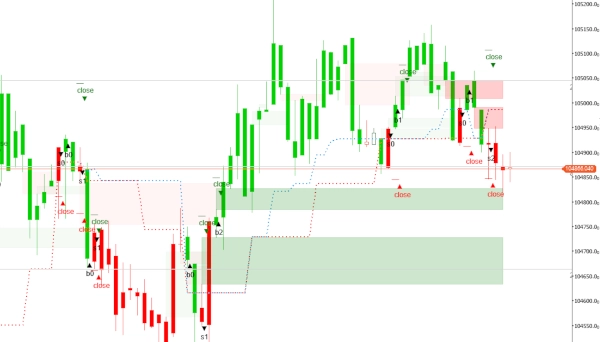
Este indicador de Brecha de Valor Justo (FVG) es una herramienta de análisis técnico diseñada para detectar ineficiencias de precio dentro de los mercados financieros. Identifica áreas donde el precio ha subido o bajado rápidamente, dejando atrás una “brecha” — una zona con poca o ninguna actividad comercial. Estas brechas a menudo señalan un desequilibrio temporal entre la oferta y la demanda, sugiriendo que el precio eventualmente puede volver para “llenar” el vacío mientras el mercado busca el equilibrio. Normalmente, se reconoce una FVG cuando una vela de precio cierra significativamente por encima del máximo o por debajo del mínimo de la vela anterior sin superposición, indicando un área potencial de reacción. Este comportamiento suele estar asociado con el comercio institucional o la actividad algorítmica. Mientras que la mayoría de las versiones de este indicador analizan desequilibrios en un solo marco temporal, la versión premium añade versatilidad al detectar y mostrar brechas de marcos temporales superiores o inferiores directamente en el gráfico actual, proporcionando un contexto más profundo para el análisis multitemporal.
Resumen de Configuraciones
- Barras a Cargar: Especifica el número de barras históricas a analizar, comenzando desde la más recientemente completada y retrocediendo.
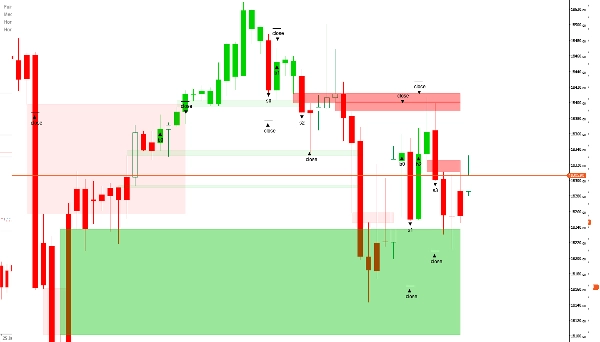
- Color FVG Alcista: Establece el color para las FVG que aparecen en una tendencia alcista. Se aplica una transparencia del 30% para que los elementos detrás de la brecha sigan siendo visibles.
- Color FVG Bajista: Establece el color para las FVG que aparecen en una tendencia bajista, también con un 30% de transparencia para una mejor visibilidad en el gráfico.
Funciones Premium (Disponibles en la Versión de Pago)
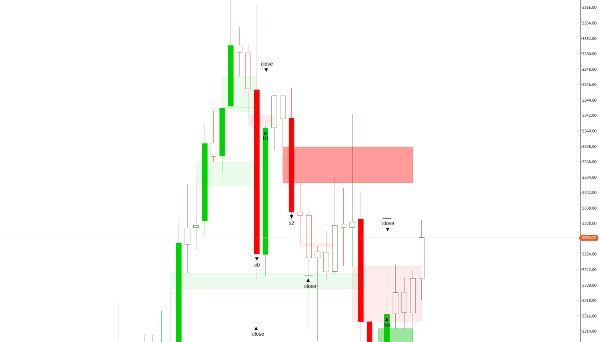
- Eliminar Brechas Cerradas: Una configuración booleana—cuando está activada ("sí"), elimina automáticamente todas las brechas cerradas; si está desactivada ("no"), las brechas permanecen visibles. Esto es particularmente útil en marcos temporales bajos (menos de 20 minutos).
- Editar/Eliminar Brechas: Permite a los traders ajustar o eliminar brechas manualmente. Esto brinda a los traders experimentados un mayor control, especialmente porque las brechas muy pequeñas típicamente tienen poca influencia en el movimiento del precio.
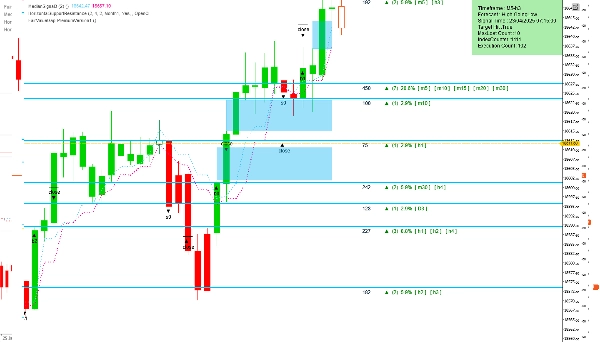
- Establecer Marco Temporal: Ofrece dos opciones—usar el marco temporal del gráfico actual o seleccionar uno diferente para el análisis, mientras se muestran los resultados en el gráfico principal. Esta función ayuda a los traders a obtener insights más rápidos sobre los movimientos probables del mercado.
- Marco Temporal Seleccionado: Especifica el marco temporal deseado para el análisis si se elige "Marco Temporal Seleccionado" en la configuración anterior.
- Precisión para Brechas Pequeñas: Permite a los traders ingresar un tamaño de brecha preferido como un número entero, ayudándoles a identificar brechas que históricamente conducen a resultados favorables. El valor se basa en todo el conjunto de datos y los tamaños de brecha observados para el activo.
Por defecto, el indicador escanea todos los desequilibrios dentro de un solo marco temporal. Sin embargo, el acceso a funciones premium a través de la FairValueGapPremium versión puede mejorar enormemente las capacidades analíticas.
Resumen
This indicator detects such gaps to highlight potential reaction zones. By default, it analyzes imbalances within a single timeframe. The premium version enhances functionality by allowing detection and display of FVGs from higher or lower timeframes directly on the current chart, supporting multi-timeframe analysis.
Key settings include the number of historical bars to analyze and customizable colors for bullish and bearish gaps with transparency for chart clarity. Premium features offer options to automatically delete closed gaps, manually edit or remove gaps, select analysis timeframes independent of the chart’s timeframe, and specify gap size accuracy to focus on significant gaps.
This tool aids traders in identifying price inefficiencies and probable market reaction areas through detailed gap analysis across multiple timeframes.
Valoraciones de clientes
5 | 100 % | |
4 | 0 % | |
3 | 0 % | |
2 | 0 % | |
1 | 0 % |


![Logotipo de "[Hamster-Coder] Bollinger Bands"](https://cdn.ctrader.com/image/webp/21d8e5d6-fb11-4bac-b9ee-cd05c2b76804_30327)
![Logotipo de "[Hamster-Coder] Pivot Points MTF"](https://cdn.ctrader.com/image/webp/4c143e5a-309c-40e3-a578-f04d1e133ffa_31159)


