
FairValueGap
Indicador
2.15K descargas
Versión 1.0, Apr 2025
Windows, Mac
4.5
Valoraciones: 2
Descripción
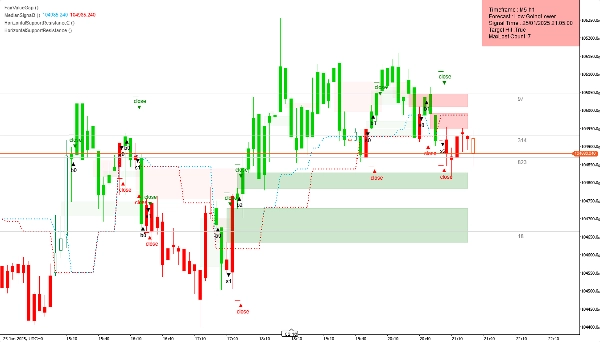
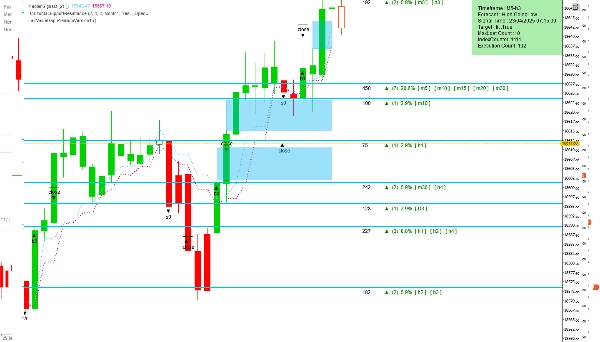
El indicador Fair Value Gap (FVG) es una herramienta de análisis técnico diseñada para identificar posibles desequilibrios de precio en el mercado. Estos huecos ocurren cuando el precio se mueve rápidamente, creando una zona con mínima actividad comercial, a menudo llamada "vacío". Tales desequilibrios pueden indicar una probabilidad de retroceso del precio, ya que el mercado tiende a buscar el equilibrio revisitando estas áreas.
Resumen de Configuraciones
- Barras a Cargar: Especifica el número de barras históricas a analizar, comenzando desde la más recientemente completada y retrocediendo.
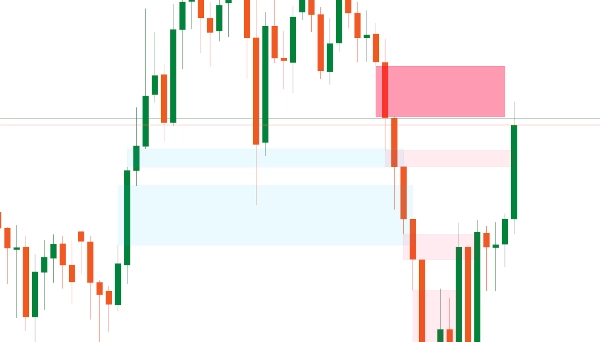
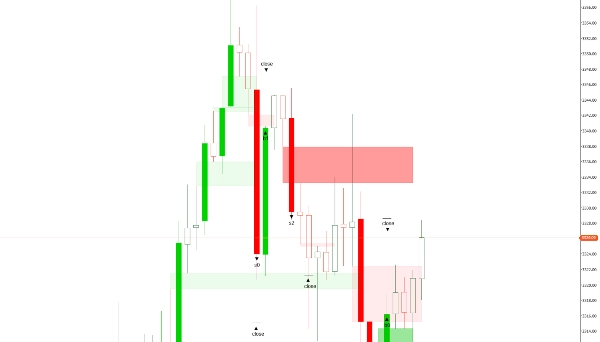
- Color FVG Alcista: Establece el color para los FVG que aparecen en una tendencia alcista. Se aplica una transparencia del 30% para que los elementos detrás del hueco sigan siendo visibles.
- Color FVG Bajista: Establece el color para los FVG que aparecen en una tendencia bajista, también con un 30% de transparencia para una mejor visibilidad en el gráfico.
Funciones Premium (Disponibles en la Versión de Pago)
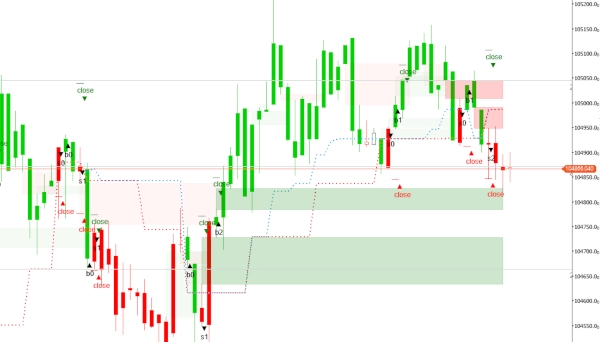
- Eliminar Huecos Cerrados: Una configuración booleana—cuando está activada ("sí"), elimina automáticamente todos los huecos cerrados; si está desactivada ("no"), los huecos permanecen visibles. Esto es especialmente útil en marcos temporales bajos (menos de 20 minutos).
- Editar/Eliminar Huecos: Permite a los traders ajustar o eliminar huecos manualmente. Esto brinda a los traders experimentados un mayor control, especialmente porque los huecos muy pequeños suelen tener poca influencia en el movimiento del precio.
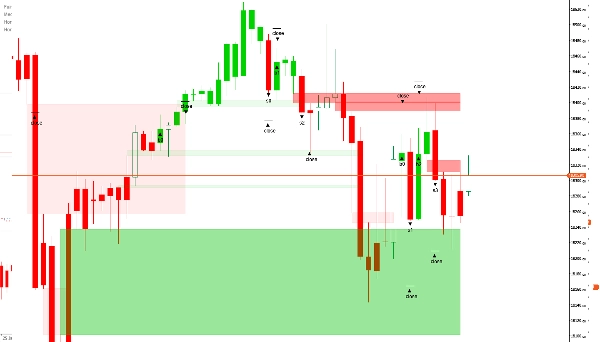
- Establecer Marco Temporal: Ofrece dos opciones: usar el marco temporal actual del gráfico o seleccionar uno diferente para el análisis, mientras se muestran los resultados en el gráfico principal. Esta función ayuda a los traders a obtener insights más rápidos sobre los movimientos probables del mercado.
- Marco Temporal Seleccionado: Especifica el marco temporal deseado para el análisis si se elige "Marco Temporal Seleccionado" en la configuración anterior.
- Precisión para Huecos Pequeños: Permite a los traders ingresar un tamaño de hueco preferido como un número entero, ayudándoles a identificar huecos que históricamente conducen a resultados favorables. El valor se basa en todo el conjunto de datos y los tamaños de huecos observados para el activo.
Por defecto, el indicador escanea todos los desequilibrios dentro de un solo marco temporal. Sin embargo, el acceso a funciones premium a través de la FairValueGapPremium versión puede mejorar enormemente las capacidades analíticas.
Resumen
Resumen de IA
The Fair Value Gap (FVG) indicator is a technical analysis tool that identifies potential price imbalances in the market. These imbalances, or "gaps," occur when price moves rapidly, creating zones with minimal trading activity, often called "voids." Such areas may signal likely price retracements as the market tends to revisit these zones to restore balance.
Key settings include:
- Bars To Load: number of historical bars analyzed from the most recent backward.
- Bullish FVG Color: customizable color for gaps in uptrends with 30% transparency.
- Bearish FVG Color: customizable color for gaps in downtrends with 30% transparency.
Premium features (available in the paid version) enhance functionality by allowing:
- Automatic deletion of closed gaps, useful for lower timeframes.
- Manual editing or removal of gaps for finer control.
- Selection of analysis timeframe independent of the chart’s timeframe.
- Input of preferred gap size to improve identification accuracy based on historical data.
By default, the indicator scans imbalances within a single timeframe, with premium options providing expanded analytical capabilities.
Perfil del indicador
Valoraciones de clientes
4.5
Valoraciones: 2
5 | 50 % | |
4 | 50 % | |
3 | 0 % | |
2 | 0 % | |
1 | 0 % |
Valoraciones de clientes
August 12, 2025
Pros: Automatically highlights the first session FVG and extends it to session end. Clean, minimal interface ideal for intraday analysis. Cons: No alerts or tooltips. Cannot save templates or track past session gaps.
August 6, 2025
Conversación
Preguntas frecuentes
Los productos disponibles a través de cTrader Store, incluidos bots, indicadores y plugins para operar, son proporcionados por desarrolladores de terceros y están disponibles únicamente con fines informativos y de acceso técnico. cTrader Store no es un bróker, por lo que no proporciona asesoramiento de inversión, recomendaciones personales ni ninguna garantía de rentabilidad futura.


Precio
Desde 19/04/2025
284.21M
Volumen operado
1.08M
Pips ganados
8
Ventas
3.46K
Instalaciones gratis