
Description
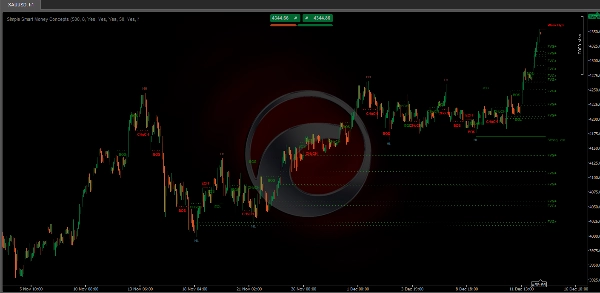
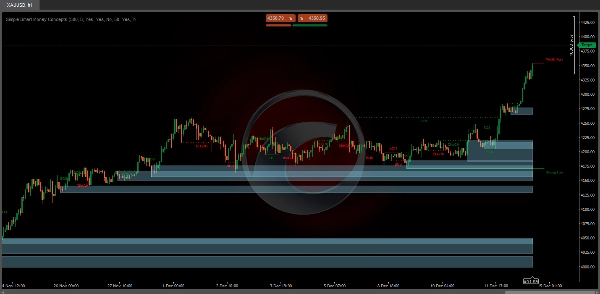
Cet indicateur Simple Smart Money Concepts affiche la structure du marché en temps réel (BOS / CHoCH interne & swing), les blocs d'ordres, les zones premium & discount, les plus hauts & plus bas égaux, et bien plus encore... permettant aux traders de marquer automatiquement leurs graphiques avec des méthodologies d'action de prix largement utilisées.
"Smart Money Concepts" (SMC) est un terme utilisé parmi les traders d'action de prix cherchant à naviguer plus précisément dans la liquidité & à trouver des points d'intérêt plus optimaux sur le marché. Essayer de déterminer où les participants institutionnels ont placé des ordres peut être une approche très raisonnable pour trouver des entrées & sorties plus pratiques basées sur l'action de prix.
Caractéristiques clés
- Structure du marché interne et swing en temps réel :
-
- Structures internes : Ces éléments se réfèrent aux formations et motifs de prix qui se produisent dans un cadre plus restreint ou une session de trading spécifique. La suite peut détecter des détails complexes comme des niveaux mineurs de support/résistance ou des retournements de tendance à court terme.
- Structures externes : Celles-ci impliquent des motifs et tendances de marché plus larges et significatifs s'étendant sur plusieurs sessions ou périodes. Cette capacité aide les traders à comprendre les directions globales du marché.
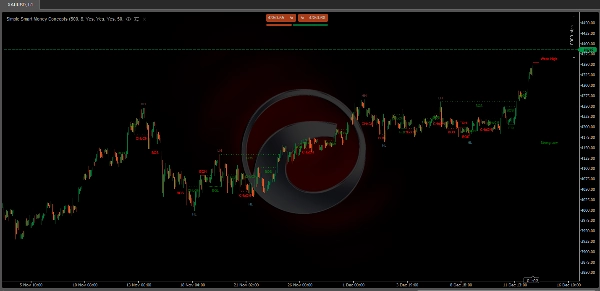
- Zones HH/LH/LL/LH :
-
- Identifier les plus hauts plus hauts (HH), les plus hauts plus bas (LH), les plus bas plus bas (LL) et les plus hauts plus bas (LH) aide à comprendre la tendance et la structure du marché, facilitant l'analyse prédictive.
- Rupture de structure (BOS) :
-
- Cette fonctionnalité identifie les points où le prix casse une structure significative, indiquant potentiellement une nouvelle tendance ou un retournement de tendance.
- Changement de caractère (CHoCH) :
-
- Détecte des changements subtils dans le comportement du marché, ce qui pourrait suggérer les premières phases d'un changement de tendance avant qu'ils ne deviennent apparents pour le marché plus large.
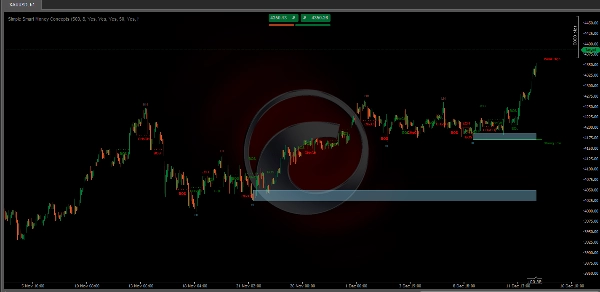
- Blocs d'ordres :
-
- Ce sont essentiellement des niveaux ou zones de prix où des activités de trading significatives ont eu lieu auparavant, pointant probablement vers les positions de l'argent intelligent.
- Plus hauts et plus bas égaux
-
- Affiche les étiquettes EQH/EQL sur le graphique pour détecter les plus hauts & plus bas égaux.
- Gaps de juste valeur :
-
- Gaps de juste valeur : Une formation de trois chandeliers où les ombres des chandeliers adjacents au chandelier central ne se chevauchent pas, cela met en évidence une zone de gap.
- Plus hauts & plus bas précédents :
-
- Permet à l'utilisateur d'afficher les plus hauts & plus bas précédents des périodes journalières, hebdomadaires & mensuelles comme niveaux significatifs
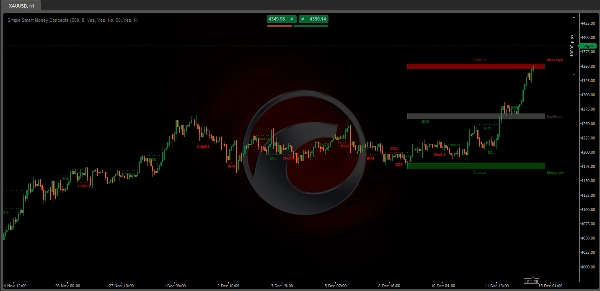
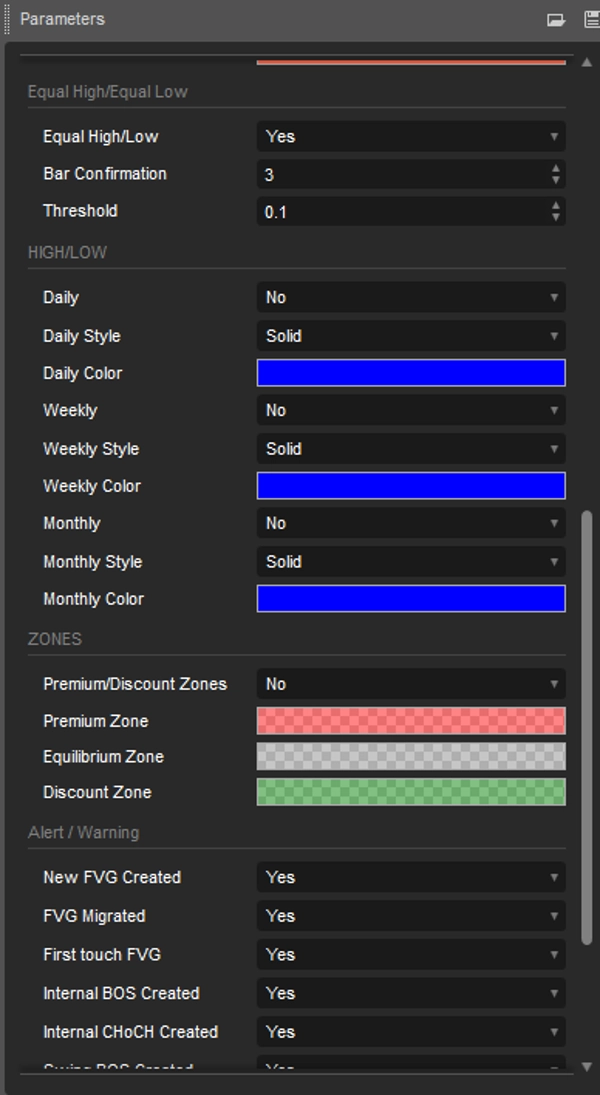
- Zones Premium & Discount en tant que plage :
-
- Permet à l'utilisateur d'afficher les zones Premium, Discount et d'Équilibre sur le graphique
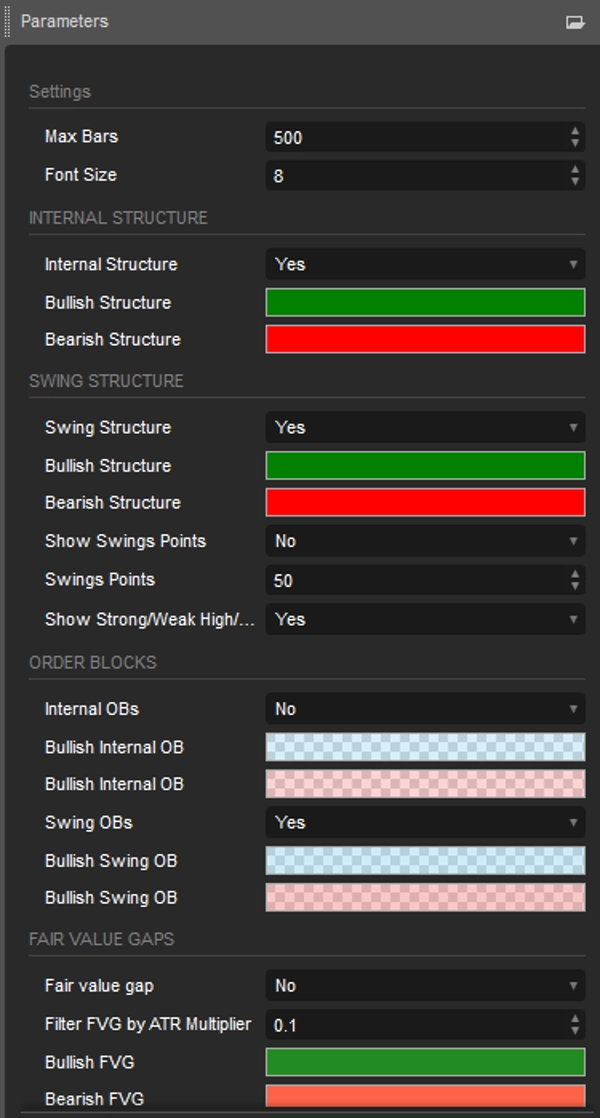
Fonctionnalités personnalisables
- Les utilisateurs peuvent ajuster des paramètres tels que la longueur des données, les couleurs et les styles d'affichage pour correspondre à leurs préférences de trading.
Avantages pour les traders
- Gagne du temps sur l'analyse manuelle, améliorant l'efficacité du trading.
- Aide à prendre des décisions rapides et éclairées lors de conditions de marché volatiles.
- Facile à utiliser pour les débutants comme pour les traders expérimentés.
Conclusion
Le Simple Smart Money Concepts Indicator n'est pas seulement un outil mais une solution complète pour les traders cherchant à mettre en œuvre efficacement les stratégies ICT. C’est un choix robuste pour améliorer l'analyse du marché et exécuter des trades précis.
Résumé
Additional features include the identification of equal highs and lows, fair value gaps (three-candle formations indicating price gaps), and previous highs and lows across daily, weekly, and monthly timeframes. It also displays premium, discount, and equilibrium zones to help traders assess value areas.
Users can customize settings such as data length, colors, and display styles to fit their trading preferences. The indicator supports analysis across multiple markets including Forex, cryptocurrencies (e.g., BTCUSD), stocks, and commodities (e.g., XAUUSD).
Designed to streamline chart analysis, the Simple Smart Money Concepts indicator aids traders in making informed decisions by visually representing widely used price action methodologies and institutional order flow concepts.
Avis clients
5 | 33 % | |
4 | 67 % | |
3 | 0 % | |
2 | 0 % | |
1 | 0 % |


