Mô tả
Định hướng Cấu trúc Heikin Ashi (Chỉ báo cTrader)
Vùng cung-cầu tự động với định hướng đa khung thời gian.
Nó làm gì – bằng tiếng Anh đơn giản
Chỉ báo này tự động:
- Đọc hành động giá Heikin Ashi và phát hiện các điểm xoay quan trọng.
- Xây dựng các vùng hỗ trợ và kháng cự động quanh các điểm xoay đó, sử dụng cả đỉnh bấc và thân nến (không chỉ là các đường ngẫu nhiên).
- Kết hợp các vùng gần nhau một cách thông minh để bạn thấy các mức rõ ràng, có thể giao dịch thay vì một rừng các đường ngang.
- Tạo ra định hướng tăng hoặc giảm rõ ràng mỗi khi giá phá vỡ hoàn toàn vùng hỗ trợ hoặc kháng cự mới nhất.
- Hiển thị cho bạn định hướng của:
-
- Khung thời gian biểu đồ của bạn, và
- Một khung thời gian cao hơn tùy chọn (mặc định H2) — mà không vẽ thêm các chi tiết HTF trên biểu đồ của bạn.
Kết quả: chỉ cần nhìn thoáng qua là bạn biết mức thực sự nằm ở đâu và thị trường hiện đang nghiêng về hướng lên hay xuống.
Vấn đề nó giải quyết
Hầu hết các nhà giao dịch đều gặp các vấn đề giống nhau:
- Các đường hỗ trợ/kháng cự vẽ tay thì:
-
- mang tính chủ quan,
- không nhất quán,
- và thường bị vẽ quá nhiều.
- Các chỉ báo “zigzag + đường ngang” đơn giản:
-
- không xử lý đúng độ rộng vùng,
- xếp chồng các mức lên nhau,
- hoặc mở rộng vùng quá rộng đến nửa biểu đồ.
- Định hướng thường chỉ “ở trong đầu bạn” – không phải thứ bạn có thể nhìn rõ hoặc dùng theo quy tắc.
Chỉ báo này được xây dựng để:
- Biến cấu trúc Heikin Ashi thành các vùng rõ ràng, khách quan,
- Cung cấp cho bạn một định hướng xu hướng/định hướng dựa trên quy tắc dựa trên các vùng đó,
- Trong khi giữ cho biểu đồ sạch sẽ và dễ đọc.
Cách xây dựng các vùng (giải thích thân thiện với nhà giao dịch)
Đối với mỗi điểm xoay Heikin Ashi, chỉ báo xem xét một cấu trúc 3 nến:
- Khi HA chuyển từ đỏ sang xanh, nó đánh dấu một điểm xoay hỗ trợ.
- Khi HA chuyển từ xanh sang đỏ, nó đánh dấu một điểm xoay kháng cự.
Sau đó nó xây dựng vùng:
Vùng hỗ trợ
- Tìm đỉnh bấc thấp nhất trong 3 cây nến (điểm cực thật sự).
- Tìm đáy thấp tiếp theo vẫn cao hơn điểm cực đó.
- Dùng thân nến (mở/cận) gần đáy trong đó để xác định phía “có thể giao dịch” của vùng.
- Vùng hỗ trợ cuối cùng:
-
- Đáy = đỉnh bấc cực thấp,
- Đỉnh = mức trong dựa trên thân nến.
Vùng kháng cự
- Tìm đỉnh bấc cao nhất trong 3 cây nến.
- Tìm đỉnh cao tiếp theo vẫn thấp hơn điểm cực đó.
- Dùng thân nến gần đỉnh trong đó.
- Vùng kháng cự cuối cùng:
-
- Đỉnh = đỉnh bấc cực cao,
- Đáy = mức trong dựa trên thân nến.
Vậy mỗi vùng không chỉ là một dải tùy ý:
Nó là một khoảng từ bấc đến thân nến thể hiện nơi giá thực sự bị từ chối hoặc đảo chiều.
Logic kết hợp (tại sao biểu đồ vẫn sạch sẽ)
Các vùng cùng loại (hỗ trợ với hỗ trợ, kháng cự với kháng cự):
- Được coi như đơn vị trên một dòng thời gian.
- Chỉ có thể kết hợp nếu chúng thực sự chồng lên nhau về giá.
- Việc kết hợp là hoàn toàn cục bộ:
-
- Một vùng mới có thể kết hợp với:
-
- vùng gần nhất (liền kề), hoặc
- vùng thứ hai gần nhất (+1 khoảng cách), và
- Một lần kết hợp “neo” bổ sung phía sau nếu vùng kết hợp mới chồng lên cấu trúc trước đó.
Điều này giữ cho hành vi trực quan:
- Các vùng không “nuốt” toàn bộ lịch sử.
- Các mức cũ được tôn trọng nhưng không cho phép tạo ra các vùng khổng lồ.
- Cấu trúc cục bộ như A–B–C hoặc A–C+D được xử lý một cách có kiểm soát.
Logic định hướng (cách bạn thực sự giao dịch với nó)
Đối với mỗi khung thời gian (chính và HTF):
- Chỉ báo theo dõi vùng hỗ trợ kết hợp mới nhất và vùng kháng cự kết hợp mới nhất.
- Sau đó, trên mỗi cây nến đóng:
-
- Nếu giá đóng cửa trên vùng kháng cự mới nhất → định hướng trở thành Tăng.
- Nếu giá đóng cửa dưới vùng hỗ trợ mới nhất → định hướng trở thành Giảm.
Nó lưu trữ:
- Thời gian của lần chuyển định hướng cuối cùng,
- Mức giá tại điểm giá phá vỡ vùng.
Trên biểu đồ, một bảng văn bản nhỏ hiển thị:
Định hướng chính (H1): TăngChuyển đổi chính (H1): 26/11 15:00 @1.08750
Nếu HTF được bật, bạn cũng sẽ thấy như sau:
Định hướng HTF (H2): GiảmChuyển đổi HTF (H2): 25/11 08:00 @1.09200
Bạn cũng có thể bật cảnh báo âm thanh khi định hướng khung thời gian chính thay đổi.
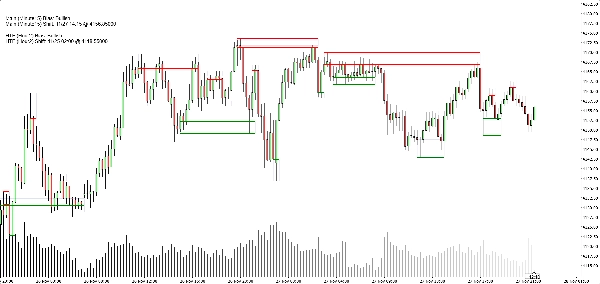
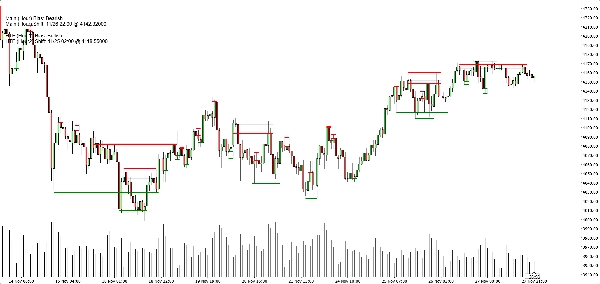
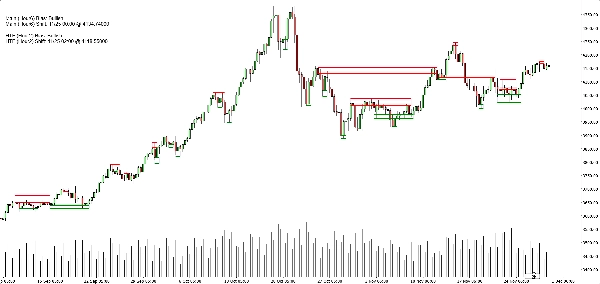
Những gì bạn thấy trên biểu đồ
- Vùng hỗ trợ:
-
- Các đường cơ sở/kích hoạt ngang màu xanh lá cây (tùy chọn),
- Một hình chữ nhật xanh đậm mềm mại (độ mờ rất thấp) hiển thị toàn bộ dải hỗ trợ.
- Vùng kháng cự:
-
- Các đường màu đỏ + hình chữ nhật xanh đậm mềm mại cho dải.
- Các tùy chọn hiển thị sạch:
-
- Hiện/ẩn vùng hỗ trợ,
- Hiện/ẩn vùng kháng cự,
- Bật/tắt các hình chữ nhật tô màu,
- Bật/tắt các đường cơ sở/kích hoạt,
- Bật/tắt bảng định hướng.
Điều này cho phép các nhà giao dịch khác nhau lựa chọn giữa:
- Một giao diện tối giản hơn (có thể chỉ là các hình chữ nhật), hoặc
- Một giao diện chính xác hơn (các đường chính xác hiển thị).
Các trường hợp sử dụng điển hình
Bạn có thể xem nó hữu ích cho:
- Lọc xu hướng
-
- Chỉ tìm mua khi cả hai định hướng TF chính và HTF đều Tăng.
- Chỉ tìm bán khi cả hai đều Giảm.
- Vào lệnh theo vùng
-
- Dùng các vùng như khu vực quan tâm cho:
-
- Lệnh giới hạn,
- Vào lệnh xác nhận (ví dụ giá quay lại vùng bị phá vỡ và bị từ chối lần nữa),
- Đặt điểm dừng ngay ngoài dải ngoài cùng.
- Phân tích từ trên xuống
-
- Định hướng HTF (mặc định H2) như bức tranh tổng thể,
- Định hướng TF biểu đồ để xác định thời điểm,
- Các vùng cho các mức thực thi cụ thể.
Nó KHÔNG phải là (quan trọng để bán hàng trung thực)
- Nó không phải là một robot tự động giao dịch cho bạn.
- Nó không phải là tín hiệu “chén thánh” đảm bảo lợi nhuận.
- Nó là một cỗ máy cấu trúc và định hướng:
-
- Xác định vùng một cách khách quan,
- Xác định xu hướng/định hướng dựa trên các vùng đó một cách khách quan,
- Giao việc quản lý giao dịch thực tế cho nhà giao dịch/chiến lược.
Tóm tắt
It provides a rule-based bullish or bearish bias by tracking price breaks above resistance or below support zones on both the current chart timeframe and an optional higher timeframe. This bias is displayed on a built-in dashboard panel, with optional sound alerts for bias changes.
The indicator works across all timeframes and markets where price forms swings, including forex, crypto, stocks, and futures. It features customizable lookback periods, automatic cleanup of old zones, and toggles for display elements to suit different trader preferences.
Typical uses include trend filtering by aligning biases across timeframes, identifying zone entries for limit or confirmation orders, and supporting top-down analysis. The tool timestamps and sequences pivots and bias shifts, facilitating automation or journaling. It is a structure and bias engine that aids traders in objectively defining market levels and trends while maintaining chart clarity.
Đánh giá của khách hàng
5 | 33 % | |
4 | 67 % | |
3 | 0 % | |
2 | 0 % | |
1 | 0 % |