
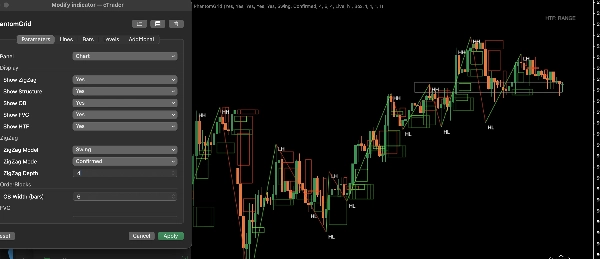
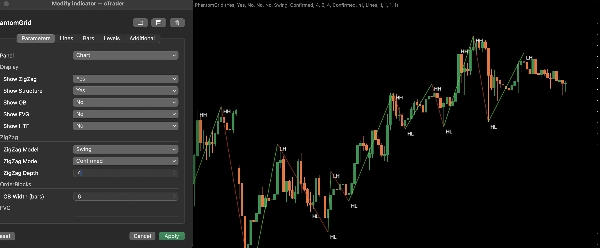
PhantomGrid 是一款专业级的网格可视化指标,旨在为价格行为分析带来清晰、结构和精确性。
它会自动绘制跨越任何符号和时间框架的动态网格水平,帮助交易者识别反应区,优化进出场点,并更有一致性地规划交易。
PhantomGrid 适用于希望拥有干净、结构化框架且无多余图表杂乱的自由裁量和系统化交易者。该指标能够平滑适应不断变化的市场条件,同时在不同环境中保持视觉清晰度和准确性。
主要特点
• 跨所有符号和时间框架的自动动态网格绘制
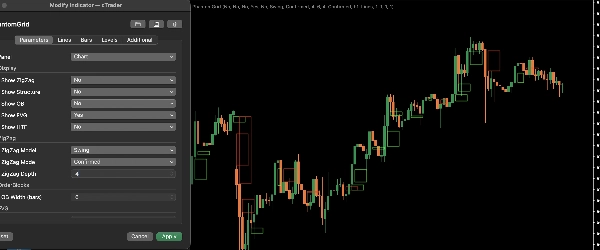
• 帮助识别反应区、流动性区域和结构化设置
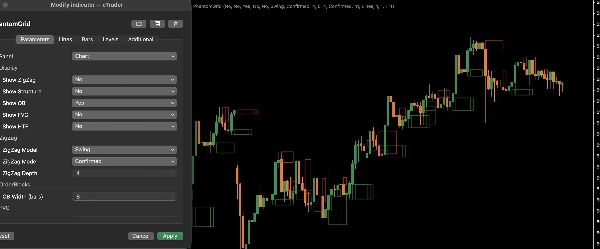
• 干净、简约的视觉设计,避免干扰分析
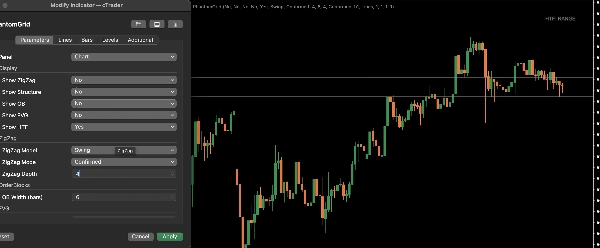
• 完全可定制的网格间距、样式和行为
• 轻量且优化以实现流畅性能
• 适用于剥头皮、日内和波段交易工作流程
交易者如何使用 PhantomGrid
PhantomGrid 帮助交易者:
• 更清晰地构建市场走势结构
• 识别高概率反应区域
• 改善进出场时机
• 更系统地管理交易
• 在不同工具间保持一致性
它既可以作为独立工具有效使用,也可以与现有策略和工作流程配合使用。
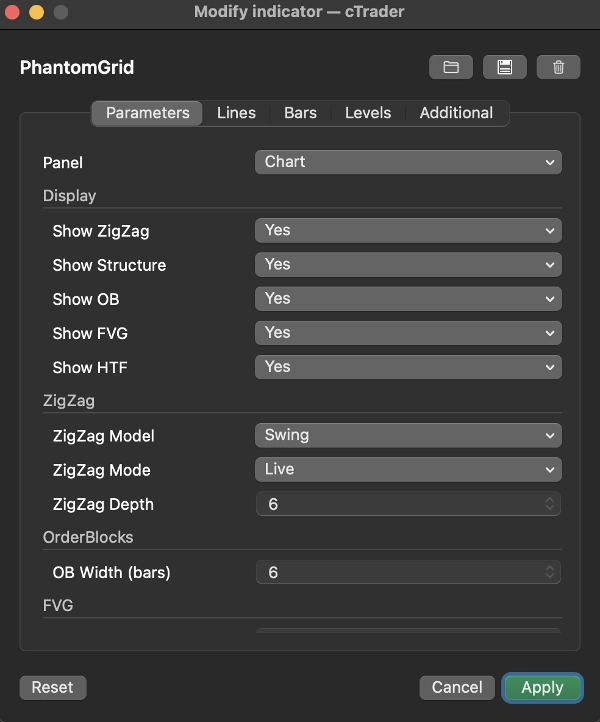
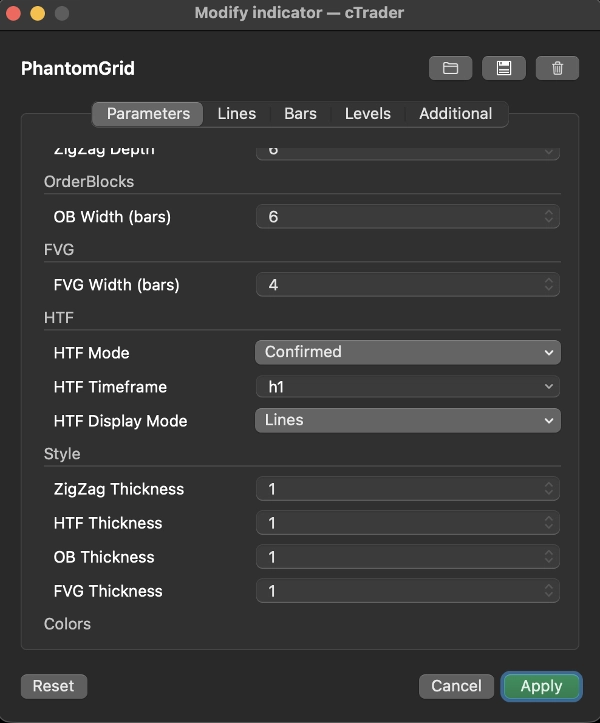
自定义选项
PhantomGrid 包含灵活的设置以匹配不同的交易风格:
• 网格间距控制
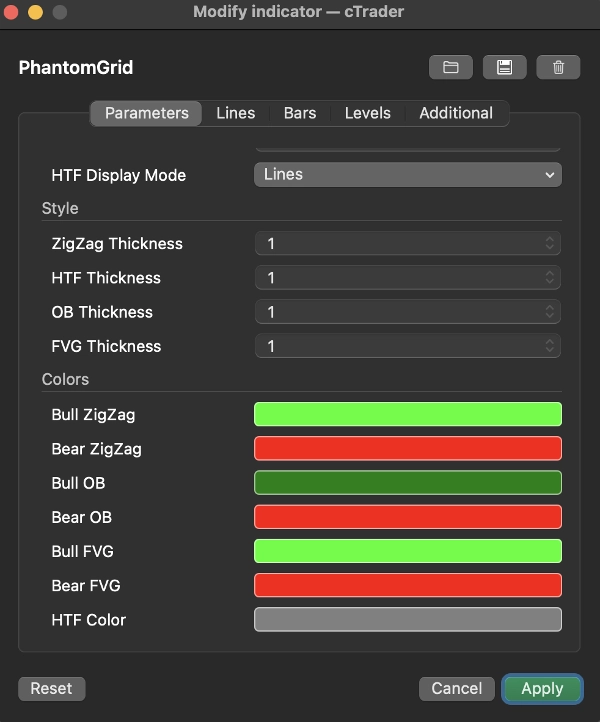
• 视觉样式和颜色设置
• 可见性调整以实现更清晰的布局
• 针对不同波动性条件的行为调节
这些选项允许交易者根据其具体工作流程和偏好定制指标。
性能与兼容性
PhantomGrid 设计为稳定、高效的性能,并能在所有支持的符号和时间框架中流畅运行于 cTrader。该指标自然集成于专业图表设置中,不会降低平台性能。
包含完整的7天试用期。无任何限制。
过去的表现不保证未来的结果。此指标仅供参考,不构成财务建议。
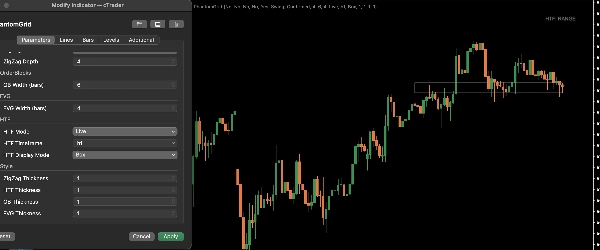
指标配置
5.0
评价:2
5 | 100 % | |
4 | 0 % | |
3 | 0 % | |
2 | 0 % | |
1 | 0 % |
BTCUSD
Forex
Breakout
Indices
EURUSD
Commodities
GBPUSD
NZDUSD
Fibonacci
Scalping
Crypto
Grid
XAUUSD
NAS100
USDJPY
VWAP
cTrader Store 提供的所有产品,包括交易机器人、指标和插件,均由第三方开发者提供,仅供信息参考和技术访问之用。cTrader Store 并非经纪商,不提供投资建议、个人推荐或任何未来业绩保证。


