
说明
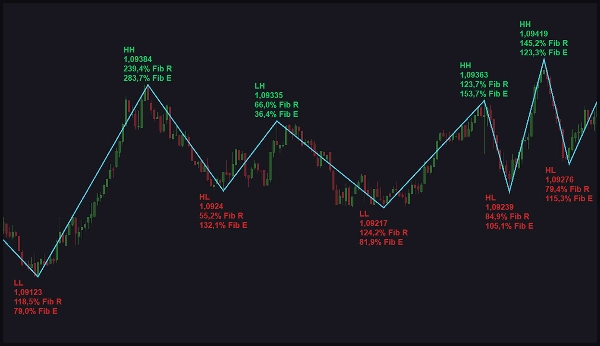
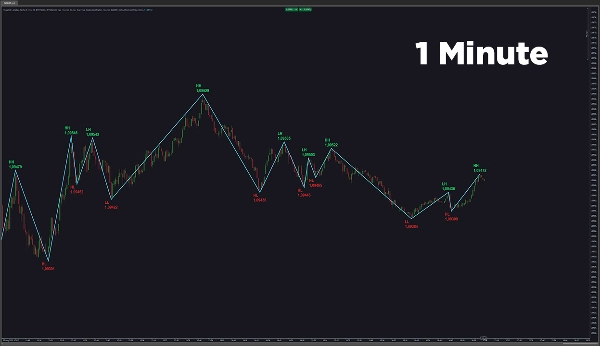
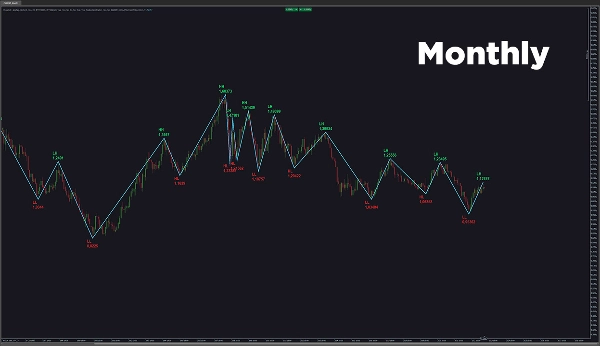
cTrader ZigZag 警报指标通过绘制更高的高点、更高的低点、更低的低点等,帮助您跟踪价格波动。它还通过比较波动计算斐波那契回撤和扩展。ZigZag 线在所有符号、时间框架和价格范围内保持一致,确保分析的可靠性。
主要功能:
- 可调节灵敏度: 根据市场状况自定义指标检测波动的方式。
- 标签选项: 在缩写标签和完整标签之间选择,便于清晰可视化。
- 字体和颜色自定义: 修改文本大小并定义看涨/看跌颜色,提高可读性。
- 波动标签和价格: 显示带有对应价格的波动标签,提供更深入的见解。
- 斐波那契水平: 查看斐波那契回撤和扩展水平,优化进出场点位。
- 警报管理: 需要时可立即暂停所有警报。
- 自定义评论: 添加在警报中显示的评论,便于识别。
- 多种警报选项: 通过声音、弹窗、Telegram 或电子邮件接收警报。
- 特定波动警报: 获取所选波动类型的警报,并可暂停警报一段时间。
- 斐波那契警报: 通过斐波那契回撤和扩展警报保持信息更新。
- 一致的 ZigZag 线: 与其他指标不同,本指标在所有时间框架和价格范围内保持统一的波动检测。
- 用户指南: 您可以通过图表上的按钮快速访问用户指南。
cTrader ZigZag 警报提供精准的波动检测和警报自定义,帮助交易者自信地做出明智决策。
摘要
AI 摘要
VegaXLR - ZigZag Alerts is a cTrader indicator designed for precise price swing analysis. It identifies and plots key swing points such as Higher Highs, Higher Lows, and Lower Lows, maintaining consistent ZigZag lines across all symbols, timeframes, and price ranges. The indicator calculates Fibonacci retracement and expansion levels by comparing swings, aiding in identifying potential entry and exit points.
Key features include adjustable sensitivity for swing detection tailored to market conditions, customizable label formats (abbreviated or full), and font and color settings to distinguish bullish and bearish swings. Swing labels display corresponding prices for enhanced clarity. Alert management options allow users to pause alerts instantly, add custom comments for easy identification, and receive notifications via sound, pop-ups, Telegram, or email. Alerts can be configured for specific swing types and Fibonacci levels, with the ability to pause alerts temporarily.
A user guide is accessible directly from the chart for quick reference. This indicator supports traders in monitoring market swings and Fibonacci levels with customizable alerts to facilitate informed trading decisions.
指标配置
客户评价
4.3
评价:3
5 | 33 % | |
4 | 67 % | |
3 | 0 % | |
2 | 0 % | |
1 | 0 % |
客户评价
February 15, 2025
Simple but not useless around swing point analysis. The useful part is reviewing reversals, pullbacks and swing zones, with the numbers checked before scaling. I would test 20 swing signals and ignore setups where the stop is wider than the 1.5R target. The level is useful when it supports the market story.
February 14, 2025
February 14, 2025
Fair pick for discipline if the trader wants it helps identify turning points and cleaner structure. It works best as support, not a final decision maker. Swing points look better after 3 pivots, especially when the 0.5 Fib area agrees with structure. the signal still needs broader context.
讨论
常见问答
Forex
cTrader Store 提供的所有产品,包括交易机器人、指标和插件,均由第三方开发者提供,仅供信息参考和技术访问之用。cTrader Store 并非经纪商,不提供投资建议、个人推荐或任何未来业绩保证。
该作者的其他作品


猜您喜欢


价格
232
销售
696
免费安装