


说明
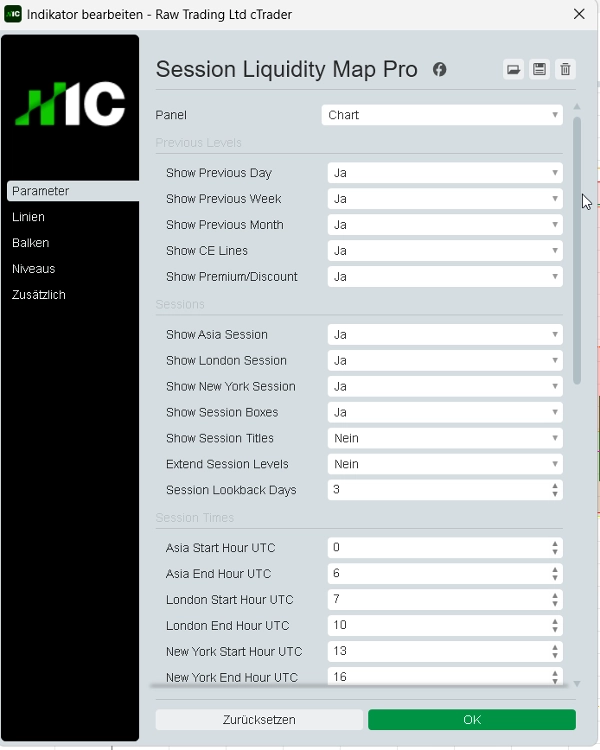
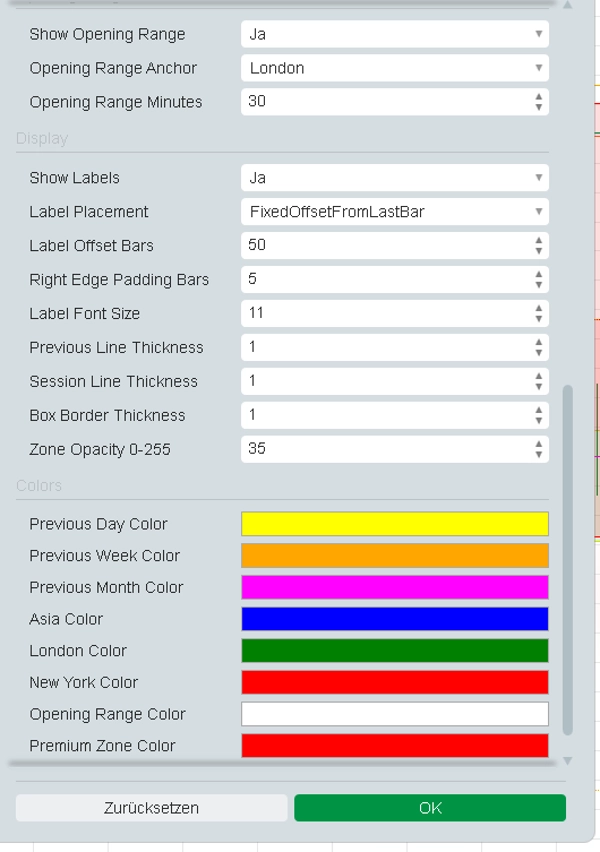
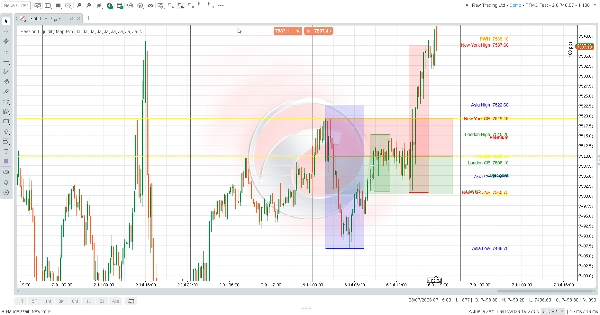
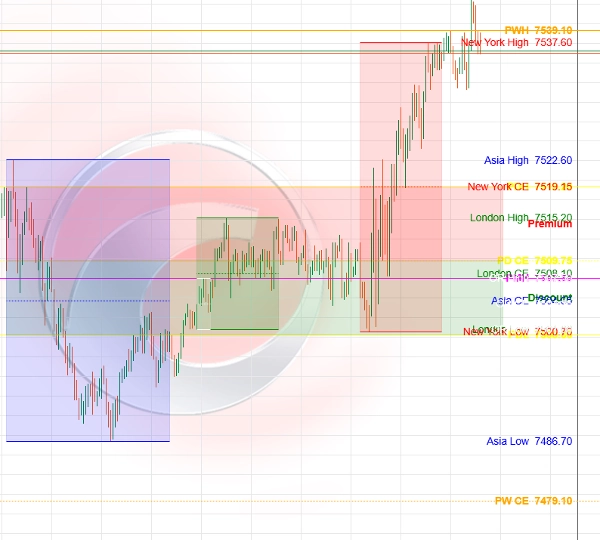
Session Liquidity Map Pro 是一个用于结构化价格行为分析的可视化 cTrader 指标。它会自动显示前一天、一周和一个月的高点/低点及均衡水平,亚洲/伦敦/纽约交易时段范围,开盘区间水平以及溢价/折价区。
该指标旨在用于图表准备、基于流动性的分析、市场结构回顾和回测研究。它不执行交易,不提供买卖信号,也不需要完全访问权限。
交易涉及风险。过去的表现不保证未来的结果。
摘要
AI summary
Session Liquidity Map Pro is a visual indicator for the cTrader platform designed to enhance structured price action analysis. It automatically maps key market data on your chart, including previous day, week, and month highs and lows, equilibrium levels, and session ranges for Asia, London, and New York. The indicator also highlights opening range levels and premium/discount zones, aiding in liquidity-based analysis and market structure review.
This tool supports chart preparation and backtesting research by visually presenting critical price levels and zones relevant to market participants. It does not execute trades or provide buy/sell signals and operates without requiring full access permissions. The indicator is categorized under market structure and provides visual outputs to assist traders in identifying liquidity sweeps, market structure shifts, key levels, and premium/discount areas.
Session Liquidity Map Pro is suitable for traders focusing on market structure concepts and price action analysis, offering a comprehensive overview of session dynamics and historical price points to inform trading decisions.
This tool supports chart preparation and backtesting research by visually presenting critical price levels and zones relevant to market participants. It does not execute trades or provide buy/sell signals and operates without requiring full access permissions. The indicator is categorized under market structure and provides visual outputs to assist traders in identifying liquidity sweeps, market structure shifts, key levels, and premium/discount areas.
Session Liquidity Map Pro is suitable for traders focusing on market structure concepts and price action analysis, offering a comprehensive overview of session dynamics and historical price points to inform trading decisions.
指标配置
指标分类
市场结构(SMC)
输出类型
可视化
数据要求
仅 K 线
支持的信号
反转
突破
趋势强度
触及水平位
突破水平位
时段开盘区间
客户评价
0.0
评价:0
客户评价
该产品尚无评价。已经试过了?抢先告诉其他人!
讨论
常见问答
Premium/Discount
Supertrend
Key Levels
MSS
Liquidity Sweep
Market Structure
cTrader Store 提供的所有产品,包括交易机器人、指标和插件,均由第三方开发者提供,仅供信息参考和技术访问之用。cTrader Store 并非经纪商,不提供投资建议、个人推荐或任何未来业绩保证。

























